


Weekly Bitcoin Technical Analysis (Septemper 6th, 2021)
History for the week (From 30th-Aug to 6th-Sep, 2021)


History for the week (From 30th-Aug to 6th-Sep, 2021)
Opening price: $48,767, closing price: $51,765 => Spread is $2989, up about 6.12%).
Highest price: $51,900, lowest price $46,512 => Spread is $5388 (According to data from Binance exchange).
Technical Analysis
BTC/USDT weekly chart
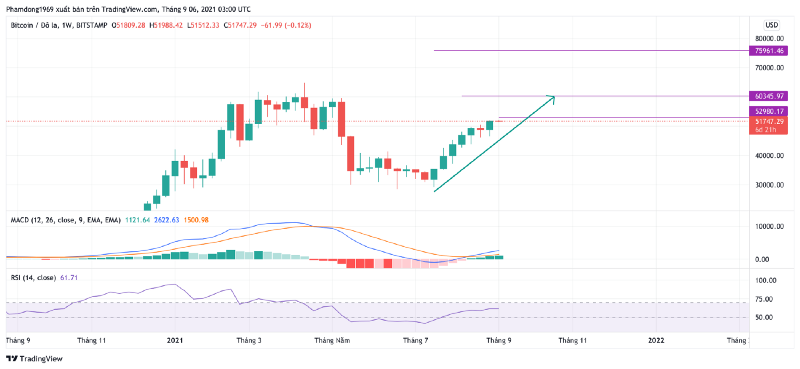
The bulls have dominating for the last few weeks. As we mentioned lastweek, the Indicators are really bullish sign.
It is worth noting that for the candlestick counting method, after a series of consecutive rising candles from 7 to 9 candles, then a corrective bearish candle will appear. Therefore, the price is likely go down at the two resistance levels of 53k and 60k.
Will the price drop be a correction or a reversal, we have to wait and see how the price reacts. Importantly, if the MACD has crossed the zero line on the weekly chart, the price drop will only happen in the short term.
BTC/USDT 4H chart
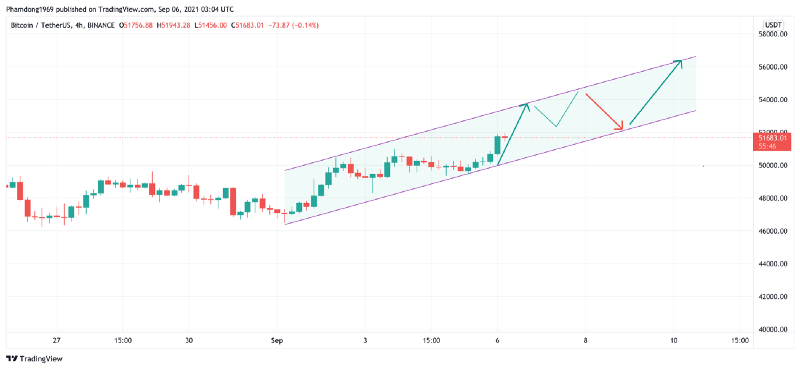
In the short-term , Bitcoin is moving in a bullish channel as BTC/USDT 4H chart. The next price target would be at ~54k and ~56k relatively.
Goodluck