Weekly Bitcoin Technical Analysis (May 24th, 2021)
Last week, there was some news that negatively affected the Crypto market such as Tesla will stop accepting Bitcoin as payment, Reuter…
Last week, there was some news that negatively affected the Crypto market such as Tesla will stop accepting Bitcoin as payment, Reuter spreading news about China’s ban on financial institutions, payments and money business. electronic,…
Bitcoin
Opening price: $46,426, the closing price closed: $34,6551.
The total weekly price decrease now exceeded 25.36%.
Highest price: $46,686, the lowest price to $30,000 => price changed $16,686, down about 55.62% (According to data from the exchanges Binance)
TECHNICAL ANALYSIS
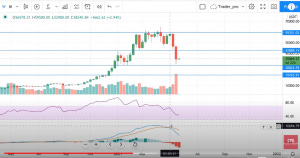
Bitstamp BTC/USD: Weekly Chart
A weekly cluster of candlesticks (11 candles) has not increased since February 22, 2021; this is a sign that people see the price of Bitcoin has fallen sharply in the last 2 weeks recently (from 10/5/2021).
The technical indicators are showing a continuing downtrend.
Specifically, the RSI is below 50; the MACD is cut down to the signal line. However, we have strong support in the price area of $28,800 — $32,200;
This is also the price area at 0.618 Fibonancy line retracement for bullish week series, MACD has crossed far from the signal line.
So, the price may continue to decrease, but the downward pressure will not be as strong as in the last 2 weeks.
Bitstamp BTC/USD: Daily Chart
The price line is still above the downtrend with no sign of stopping.
The RSI has turned up and returned to the 30 zones; the MACD has moved away from the zero line
Combining the above signals and there will be no daily close below $30,000 in the next few days, we can conclude that the price may not move much (sideway) shortly. Otherwise, the price will break down to the $20,000 zone (Fibonance retracement 0.786 support area).
Bitstamp BTC/USD: 4H Chart
On the 4h we saw appeared candles 1Doji and the candles increase after the Doji, the price can is in the recovery phase, there are currently no candles 4h close above the price zone 37.000 $, so we can’t have hope of a tranche recovery price strength.
Bitcoin Price Prediction
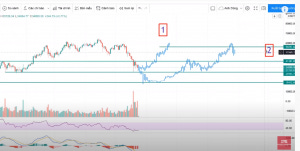
Scenario 1 (as shown above): We expect the price will go horizontal region to $ 30,000 the next few days then will increase the price from $41,000— $42,000
. If beyond this area, the price will continue to rise up the $59,000—$ 60.000. Conversely, if not to be the $41,000 – $42,000 then the price will fall back again. We will analyze next to the price direction running reality.
Scenario 2 (as shown above): the Price will drop on the $19,000–$20,000 (regional road Fibonance regressive 0.718), then passing this area and increase backwards.


