Weekly Bitcoin Technical Analysis (June 7th, 2021)
History for the week (From May 31 to June 6, 2021)

History for the week (From May 31 to June 6, 2021)
Opening price: $35,641, closing price: $35,796 => Spread is $155, up about 0.43%).
Highest price: $39,476, lowest price $34,153 => Spread is $5,323, down about 13.48% (According to data from Binance exchange).
Fundamental Analysis
We summarized some outstanding information from last week:
Positive news:
· The Reserve Bank of India clarified that banks should not refer to the 2018 ban on cryptocurrency transaction.
· President of El Salvador Says He’s Submitting Bill to Make Bitcoin Legal Tender.
Negative news:
· On Weibo (China’s Twitter), a large number of cryptocurrency KOL accounts have been blocked. This is the harshest suspension of crypto in history, and it may be a response to Beijing’s crackdown policy.
· Elon Musk posted a tweet suggesting he’s fallen out of love with the world’s top cryptocurrency.
Technical Analysis
BTC/USDT weekly chart
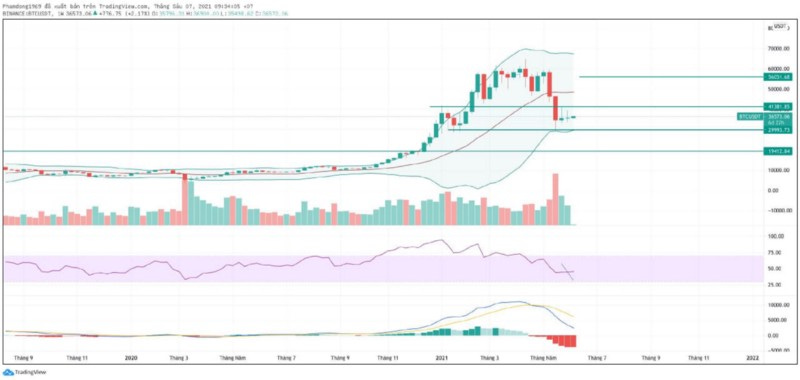
In the weekly chart, Bitcoin price is still in a downtrend. It has no signs that prove the Bitcoin price will be recovery in this week. If we have a candle that closes below 29k or above 41k in weekly chart, Bitcoin price trend will be clear enough.
BTC/USDT 4D chart
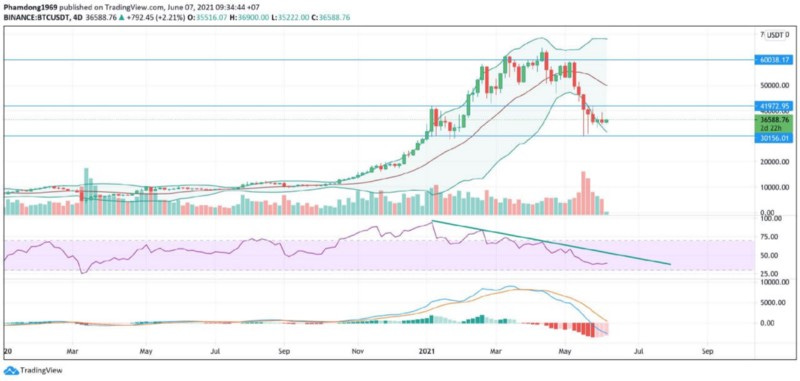
The downtrend is still visible in the 4D chart. However, we have some positive signals:
· The histogram of MACD is fading and moving up to the MACD’s baseline.
· RSI is going up to touch the trendline that we plotted in the graph. But for the time, at least 12 more days before this happens.
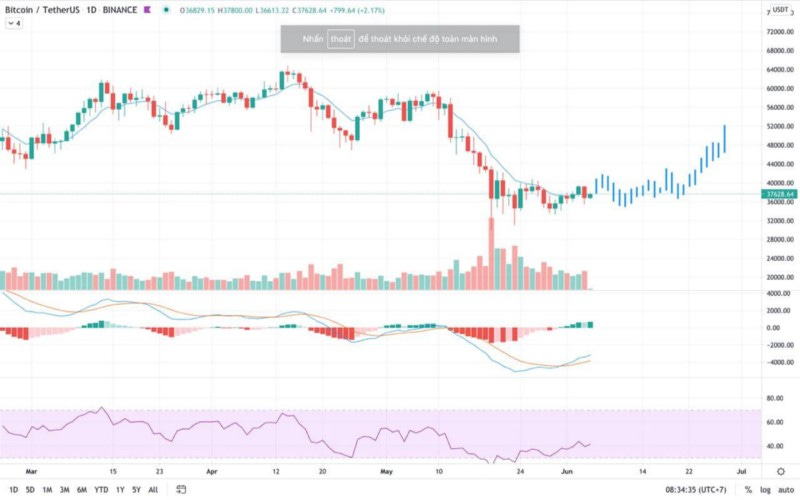
BTC/USDT daily chart
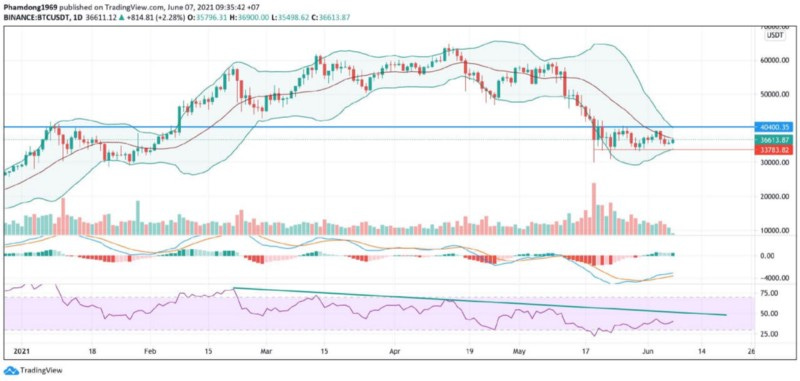
In the daily chart, the next trending move is likely be a bullish momentum.
MACD is crossing above its signal line and the histogram is being above the baseline.
Bollinger Bands is shrinking, the price will go sideways in range of 33k to 40k for the next 2–3 days. And if the price turns up to and closes above 37k, it will suggest the bull in the short term. Conversely, it turns down below 33k, there will be very bad signs for the market.
Price prediction for the short-term