Weekly Bitcoin Technical Analysis (June 28th, 2021)
History for the week (From 21 to 27June , 2021)
History for the week (From 21 to 27June , 2021)
Opening price: $35,600, closing price: $34,700 => Spread is $900, down about 2.5%).
Highest price: $35,750, lowest price $28,805 => Spread is $6945 (According to data from Binance exchange).
Fundamental Analysis
We summarized some outstanding information from last week:
Negative news:
UK regulator bans Binance from regulated activities in the country.
Japan’s FSA Warns Binance Again For Operating Without a License.
Positive news:
Andreessen Horowitz raises $2.2 billion for its largest ever cryptocurrency fund.
El Salvador is giving away free Bitcoin to its citizens.
Citigroup Launches Digital Assets Group to Provide Clients Access to Cryptocurrencies.
NYDIG and Q2 Announce Collaboration to Offer Integrated Bitcoin Solutions for Financial Institutions via Q2’s Digital Banking Platform.
Technical Analysis
BTC/USDT weekly chart
Bitcoin price closed forming a hammer candle, the current main trend is still bearish. Although with the appearance of the hammer candle in the downtrend, we still can not confirm the trend will reverse to the upside. We may have to wait at least two more weeks to determine the next trend.
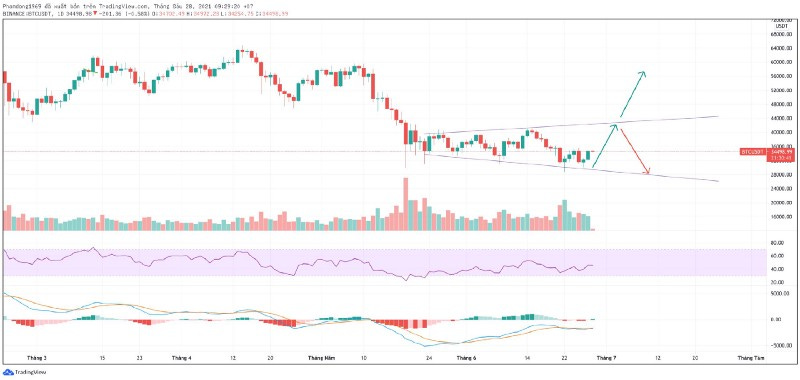
BTC/USDT daily chart
The daily chart is forming an expanding triangle pattern. We expect the price will move to the upper side of the triangle, then it will has two scenario as below:
The price will break resistane zone at 41k~42k then go straight up to the next range 57k~58k.
Conversely, if the bulls can not push the price above 41k~41k, it may go back to the support zone 29k~30k again. It’s very bearsish if this case happen.
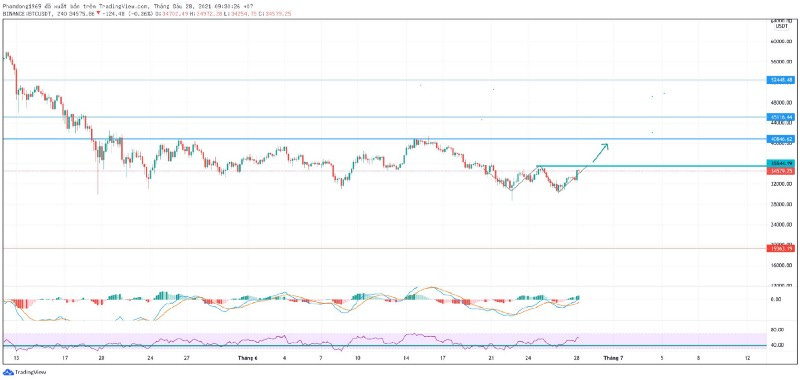
BTC/USDT 4H chart
he 4-hour chart shows Bitcoin price is forming a double bottom pattern. If the bull in short-term push the price above $35.052 (resistance of the pattern), the next price target will be at the range 41k-42k. This scenario is domiating for the bull.


