Weekly Bitcoin Technical Analysis (June 21th, 2021)
History for the week (From 14 to 20June , 2021)
History for the week (From 14 to 20June , 2021)
Opening price: $39,020, closing price: $35,424 => Spread is $3,596, down about 9.22%).
Highest price: $41,385, lowest price $33,336 => Spread is $8,049 (According to data from Binance exchange).
Fundamental Analysis
We summarized some outstanding information from last week:
Negative news:
China to shut down over 90% of its Bitcoin mining capacity after local bans
Binance Australia users consider class action over cryptocurrency exchange meltdown
Technical Analysis
BTC/USDT weekly chart
The chart shows the bearish engulfing patterns that occurred lastweek. This one is showing a pretty clear downtrend. If this week’s candle closes below previous one’s opening price ($35,600) , a move will be a huge negative and it could delay the start of the next leg of the uptrend.
Conversely, if the BTC/USDT pair rebound off in range (39k~40k), the bulls will again try to defend this level.
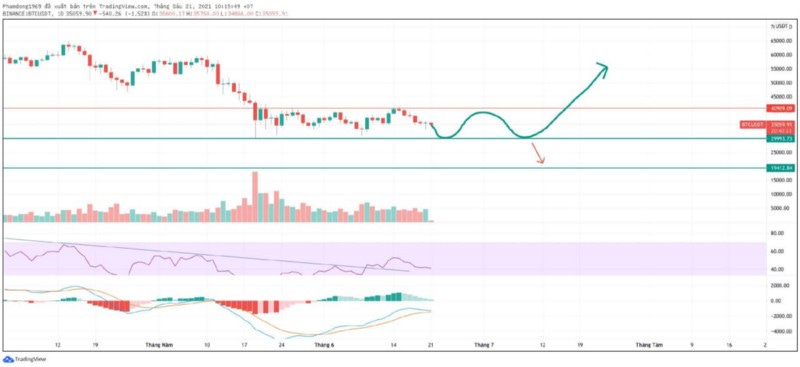
BTC/USDT daily chart
The downtrend is still present on the daily chart. MACD is converging with the signal line, so we will analyze 2 possible cases this week:
If MACD cross below the signal line, the Bitcoin price will fall to the support level (~33k). On the other hand, if MACD touch and diverge the sinal line, it will invalidate the bearish pattern.
BTC/USDT 4h chart
On the 4-hour chart, a bearish channel is forming. The price is closing to the upper boundary of the channel. If itcan break the boundary, the next target will be 41k in the short-term. However, the price is very difficult to break up, the bear would take the control and sink the price to the support of the range at 31k- 32k in the current situation.


