


Weekly Bitcoin Technical Analysis (June 14th, 2021)
History for the week (From 7 to 14 June , 2021)

History for the week (From 7 to 13 June , 2021)
Opening price: $35,798, closing price: $38,993 => Spread is $3,195, up about 8.92%).
Highest price: $39,380, lowest price $30,976 => Spread is $8,404 (According to data from Binance exchange).
Fundamental Analysis
We summarized some outstanding information from last week:
Positive news:
· El Salvador has become the first country in the world to officially classify Bitcoin as legal currency
· More countries line up to make Bitcoin legal tender (Paraguay, Panama, Mexico, Venezuela, India,…)
· Bitcoin jumps hardly after Elon Musk says Tesla will accept crypto when miners use clean energy on this Sunday
Technical Analysis
BTC/USDT daily chart
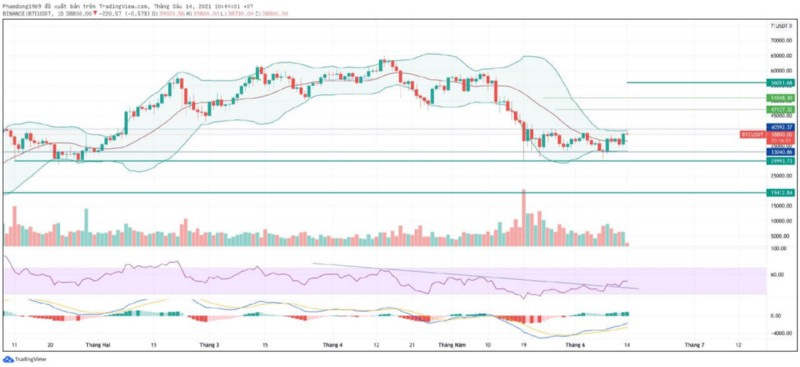
In the daily chart Bitcoin has shown clear bullish signs. The indicators have extremely positive for the bull in the short-term.
· RSI is moving up to the 50 zone and has crossed the trend line resistance
· MACD is being above the signal line, therefore, the histogram is positive
Conclusion: We had a bullish candle closing above the MA20 of the Bolliger Bands. However, the bands is tigntening, so prices will trade within a narrow range between a high of ~$41k, and down to low of ~$33k until it may break the upper bands. That could pull the price up to the different resistance level of ~47k, ~51k and ~56k , respectively.