


Weekly Bitcoin Technical Analysis (July 5th, 2021)
History for the week (From 28June to 4July , 2021)

History for the week (From 28June to 4July , 2021)
Opening price: $34,669, closing price: $35,286 => Spread is $617, up about 1.78%).
Highest price: $34,357, lowest price $35,967 => Spread is $1.610 (According to data from Binance exchange).
Fundamental Analysis
We summarized some outstanding information from last week:
Negative news:
Bank of Mexico shoots down billionaire Ricardo Salinas’ plans to bring bitcoin to Banco Azteca.
Binance Cryptocurrency Exchange Faces Criminal Complaint From Thailand SEC for Operating Without Licence.
Positive news:
Soros Fund Management, the family investment firm managed by billionaire George Soros has been given the green light to trade Bitcoin.
Softbank invests $200 illion In Brazil’s Largest Crypto Exchange.
German law allowing $415B Investment Into Crypto takes effect.
Technical Analysis
BTC/USDT weekly chart
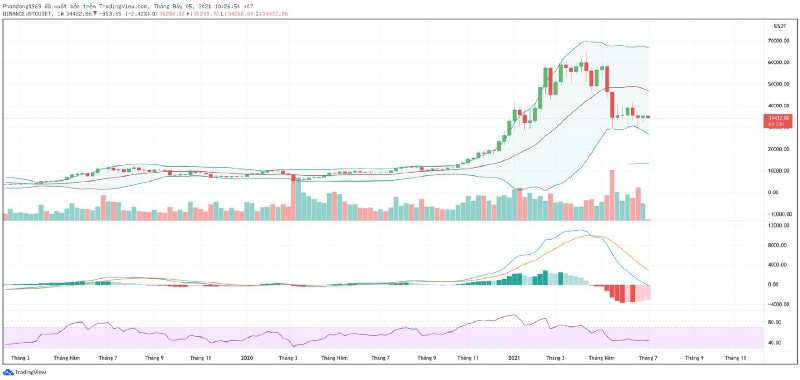
Bitcoin price closed with a spinning top candle, the current main trend is still bearish as the lastweek’s analysis. If the candle closes below 33k this week, the probability of a big drop will be very high. We will analyze further on smaller time frame as below
BTC/USDT daily chart
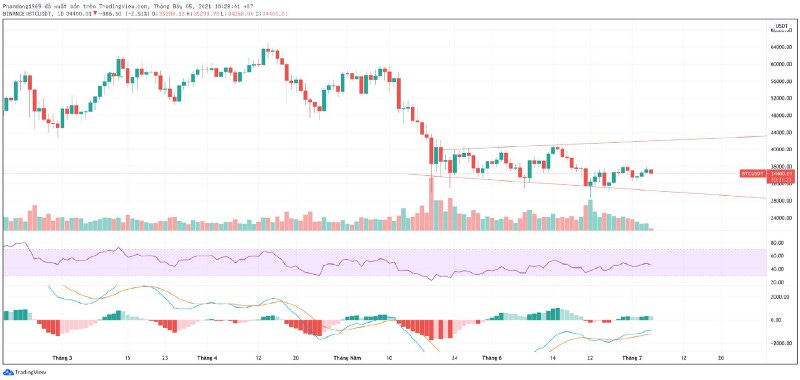
As the previous analysis, the daily chart is forming an expanding triangle pattern with a bullish signal in a short-term. However, the bears are likely to defend this zone aggressively because the current trading momentum is very weak. It can not push the MACD away from the signal line and RSI is also still being in a negative zone.
BTC/USDT 4H chart
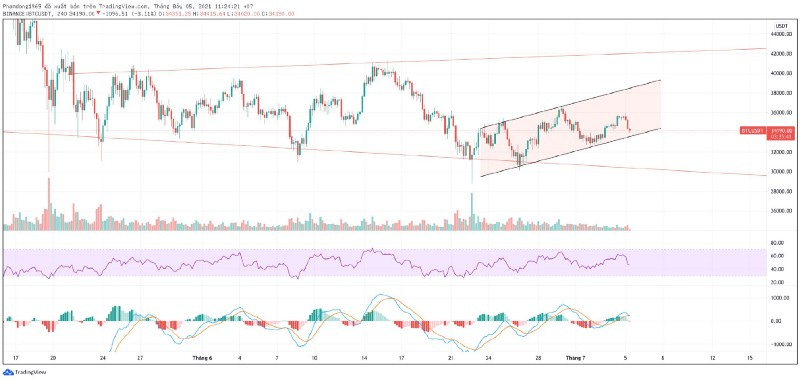
The 4H chart is forming a parallel rising channel with a supporting zone ~33.5k. If the price break below this zone, it may goes down to the daily’s supporting zone at 29k~30k. Contrary to this assumption, Bitcoin price will move up to the upper boundary at ~38k.
Conclusion
Bitcoin is still in a bear market, there is no sign of a market recovery yet. The possibility of falling to 20k is still very high. We need to closely observe this phase of the market to come up with the most effective investment strategy.