


Weekly Bitcoin Technical Analysis (July 26th, 2021)
History for the week (From 19July to 25July , 2021)

History for the week (From 19July to 25July , 2021)
Opening price: $31,778, closing price: $35,398 => Spread is $3620, up about 11.4%).
Highest price: $35,398, lowest price $29,278 => Spread is $6120 (According to data from Binance exchange).
Fundamental Analysis
We summarized some outstanding information from last week:
Negative news:
Group of Salvadorans take to the streets to protest El Salvador’s New Bitcoin Law
EU proposes Law to ‘ensure full traceability’ of crypto Transfers, ban anonymous wallets
Switzerland’s largest bank UBS warned that clients have crypto FOMO
Positive news:
Rothschild Investment Corp shared in a new filing that it has more than tripled its bitcoin exposure through GBTC over the past quarte.
Amazon is looking to accept Bitcoin payments ‘by the end of the year’, and is investigating its own token for 2022.
Jack Dorsey Calls Bitcoin a ‘Big Part’ of twitter’s future as a Global Currency.
Circle K beploys bitcoin ATMs in stores across US and Canada — Over 700 machines already installed
Goldman Sachs survey shows family offices are looking to crypto investments
Technical Analysis
BTC/USDT weekly chart
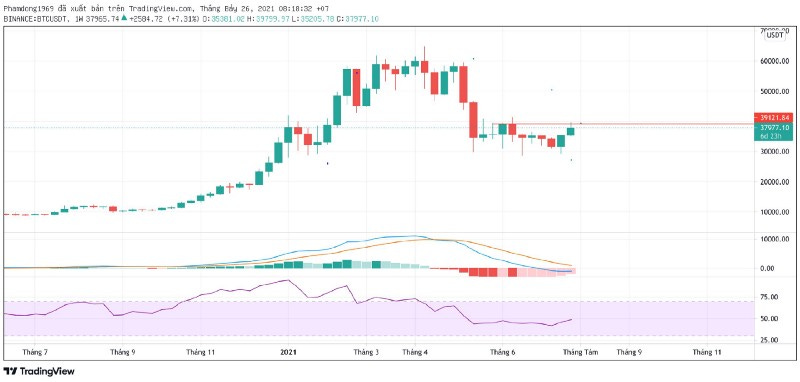
Bitcoin rallied and closed with a strong green candle, it’s almost a bullish engufing of the previous three weeks. This is a possitive signal for the market, however, we should note that the technical indicators on the weekly chart are still in a downtrend.
The reversal signal will become apparentl if there is a weekly close above 39k in the next few weeks
BTC/USDT daily chart

For the daily chart, the Bitcoin price is breaking above of a decreasing triangle pattern as we predicted in last week’s report.
In Jul, 21st, 2021, we can see a strong bullish candel appeared with a spike in trading volume and the next day’s movement was a continuous bullish candle cluster. It broke all resistance zones (~33k, ~35k) of the channel as the chart above. With the current price action, we expect it’ll break the next resistance at ~41k.
If there is a daily close above range 41k, we can be confident that Bitcoin price is likely to reverse to the upside in the near future.
Goodluck!