


Weekly Bitcoin Technical Analysis (July 12th, 2021)
History for the week (From 5July to 11July , 2021)

History for the week (From 5July to 11July , 2021)
Opening price: $35,293, closing price: $34,258 => Spread is $1035, down about 2.93%).
Highest price: $35,293, lowest price $32,077 => Spread is $3.216 (According to data from Binance exchange).
Fundamental Analysis
We summarized some outstanding information from last week:
Negative news:
TikTok bans cryptocurrency-Related Ads.
Barclays bans UK customers from making card payments to Binance, citing a notice from the national regulator.
A Beijing office of China’s central bank had ordered the shutdown of a Beijing-based software maker over its suspected involvement in cryptocurrency trading.
Positive news:
$55 Billion Hedge Fund Firm Marshall Wace Planning Investments in Crypto Sector.
Visa announced that its cryptocurrency-backed credit card is growing in popularity. Users of the card had spent more than $1 billion worth of cryptocurrency globally on goods and services in the first six months of the year.
Argentine Deputy for Mendoza proposes crypto salaries in new Bill.
Technical Analysis
BTC/USDT weekly chart
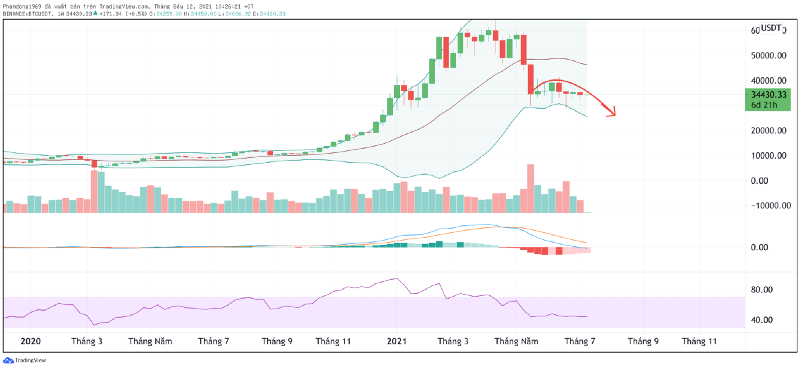
Last week was a bearish week, formed a bearish hammer candle. Bitcoin price are getting worse signs:
Bollinger Bands: The lower is expanding downwards
MACD: The MACD line is touching to the zero line and there is no sign of an upward reversal yet
=>The bears are still dominating and getting stronger. The downtrend may end when we have the candle of the weekly chart closes above ~$39000
BTC/USDT daily chart
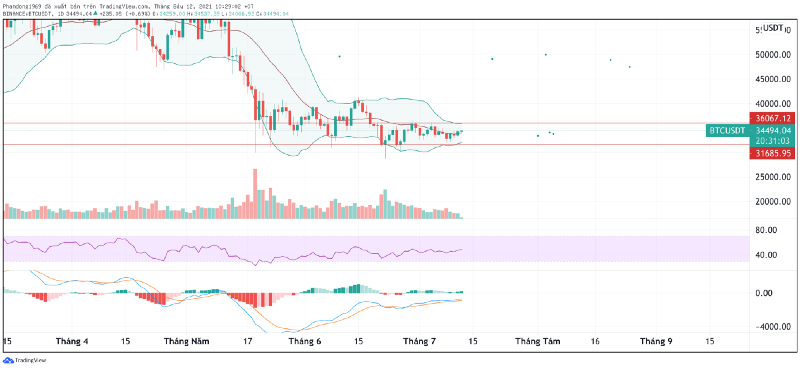
In the last 7 days, it was a period of low volatility. The bands are tightening that could make the price will trade within a narrow range between a high of ~$35k, and down to low of ~$31.7k in next few days.
=> When the price breaks through the upper band or the lower band, the Bitcoin price will follow that trend for a short time.
BTC/USDT 4Hchart
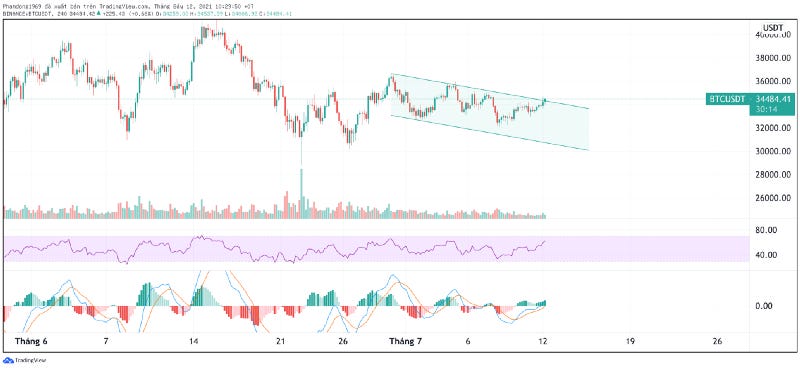
The 4H chart is forming a short-tem bearish channel. If the price break above this zone (~34.4k) in the next few hours, it may goes up to the resistance zone (~36k — 37.7k) . Contrary to this assumption, it will turn down at the lower boundary of the channel (~30k).