


Weekly Bitcoin Technical Analysis (October 11th, 2021)


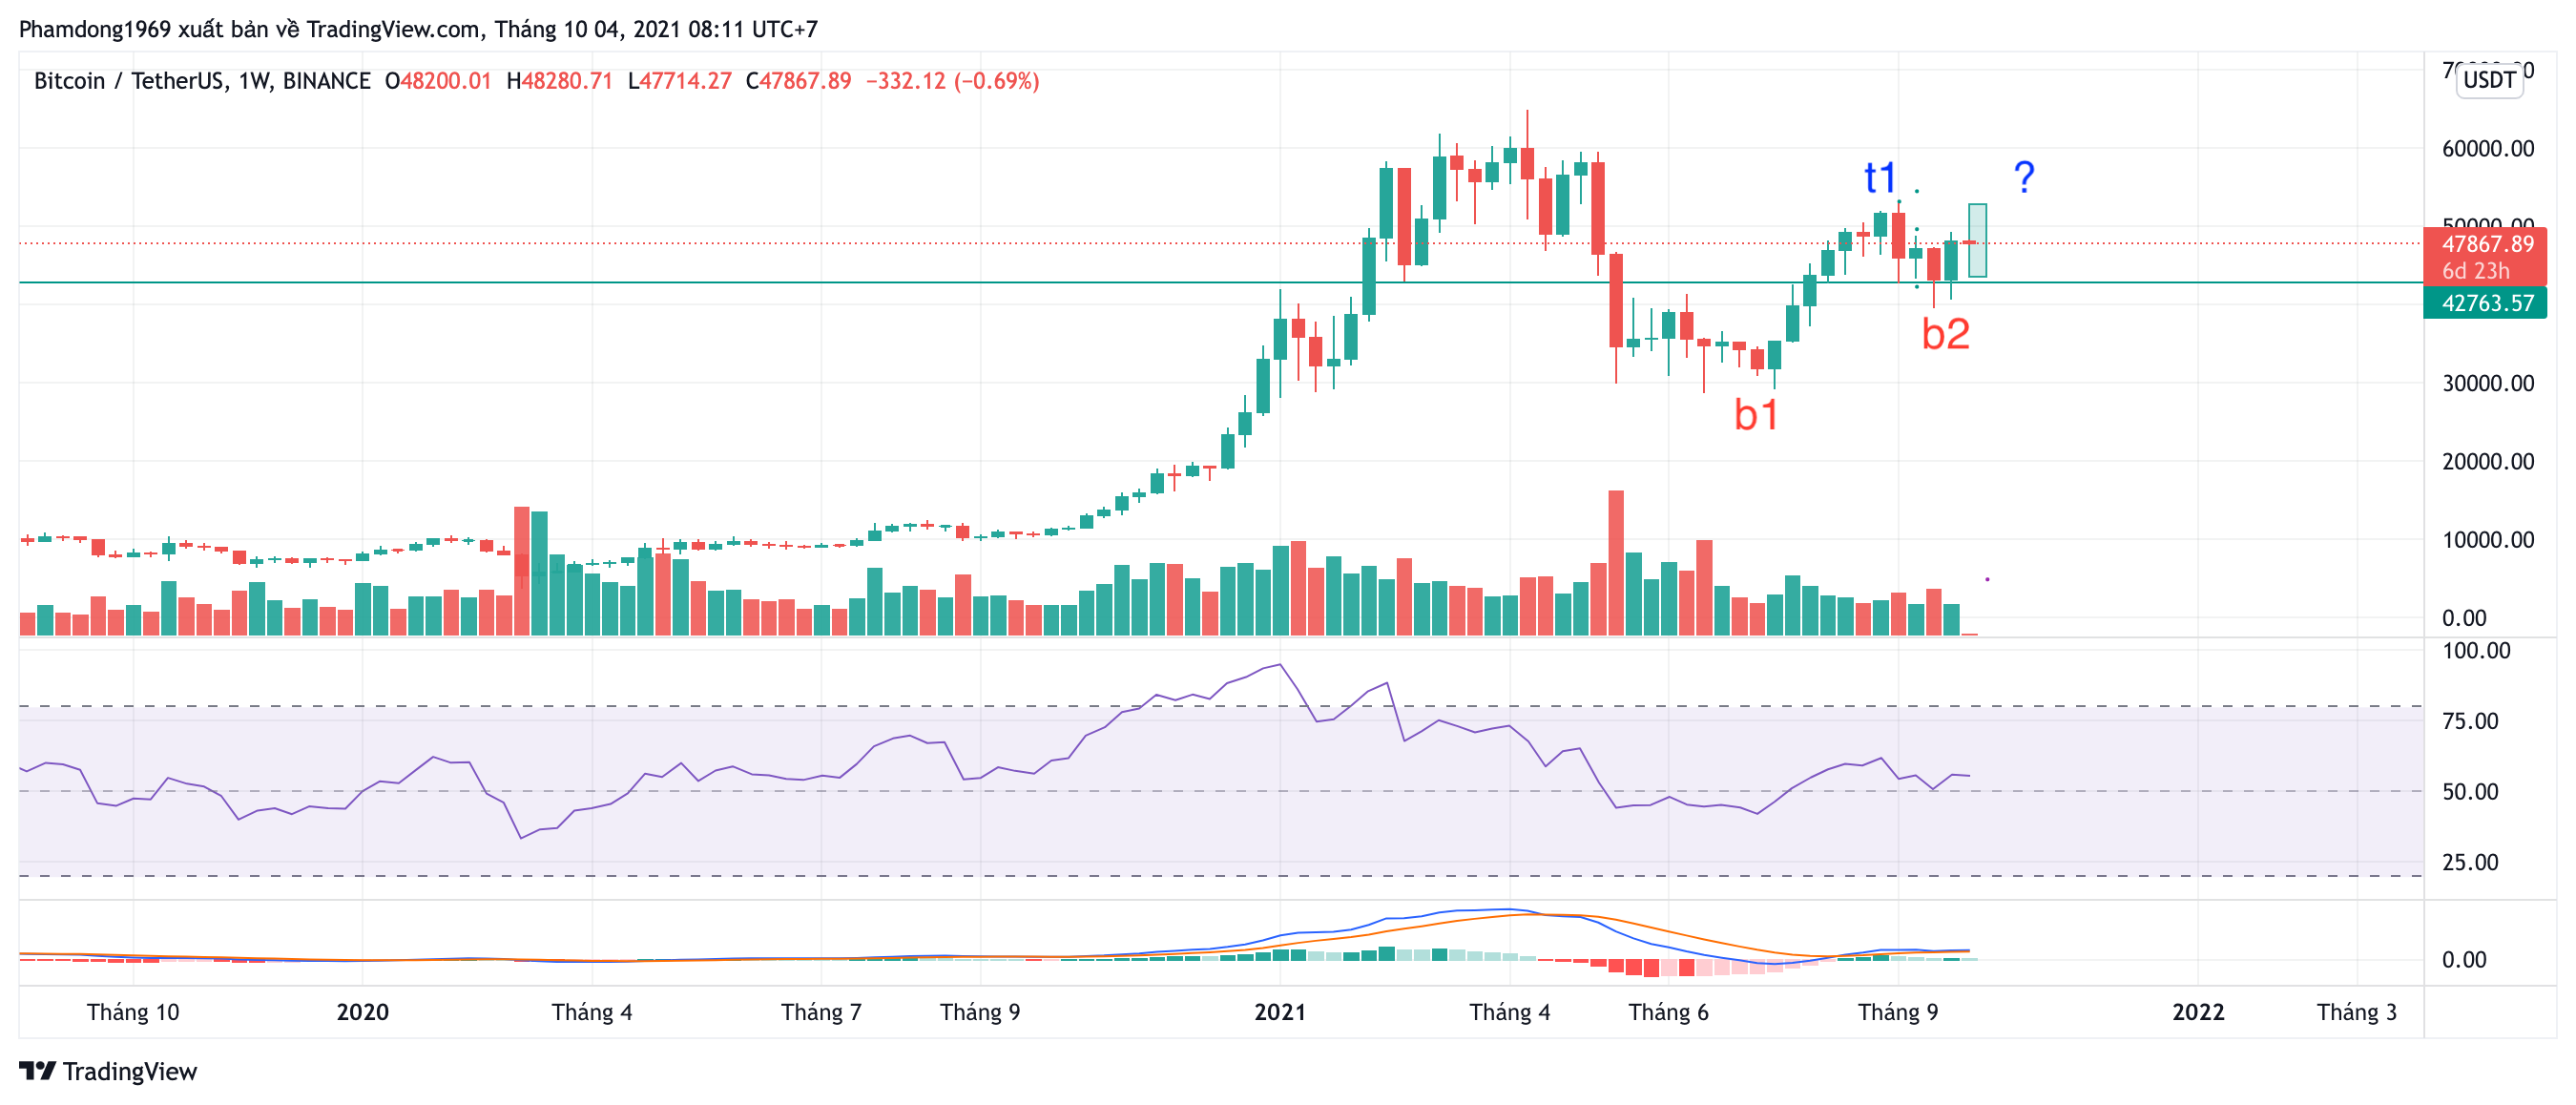
History for the week (From 4th-10th/Oct, 2021)
Opening price: $48,200, closing price: $54,659 => Spread is $6459, up about 13,4%).
Highest price: $56,561, lowest price $46,891 => Spread is $9670 (According to data from Binance exchange).
Technical Analysis
BTC/USDT weekly chart
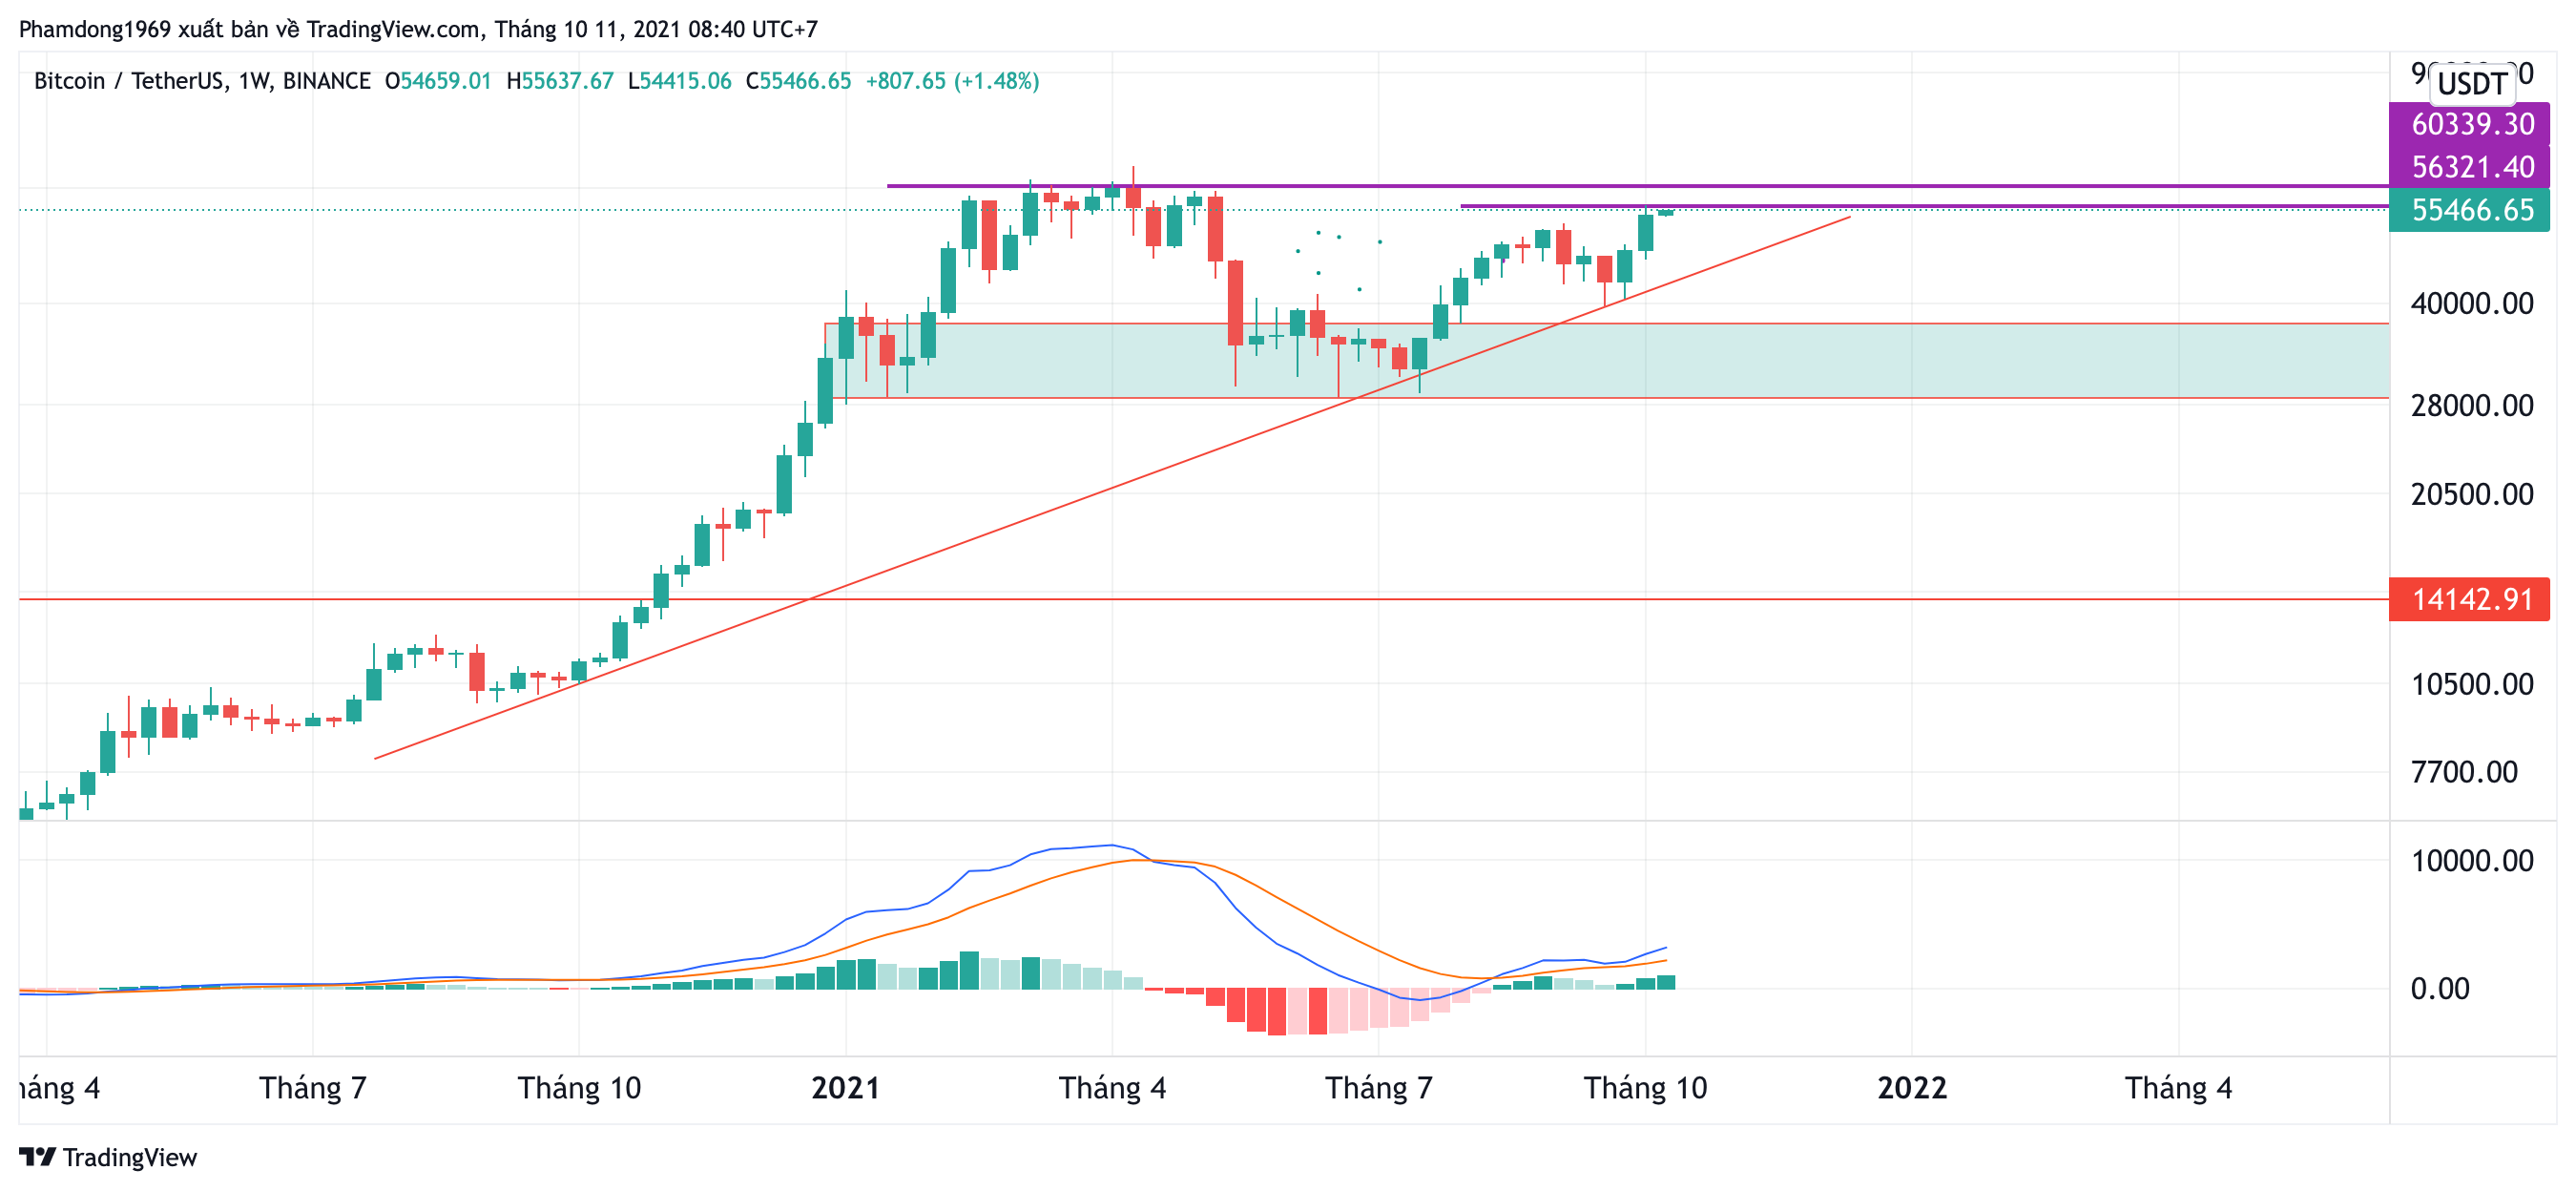
As reported last week, the Bitcoin price has formed an uptrend line. The bulls pushed the price above the breakout level at $51,765.
MACD rises above the signal line and it’s moving away from the signal line , the indicator gives a bullish signal
Combining the price trendline and the indicator such as MACD, we can confirm that Bitcoin is entering a long-term bull cycle.
BTC/USDT 4H chart
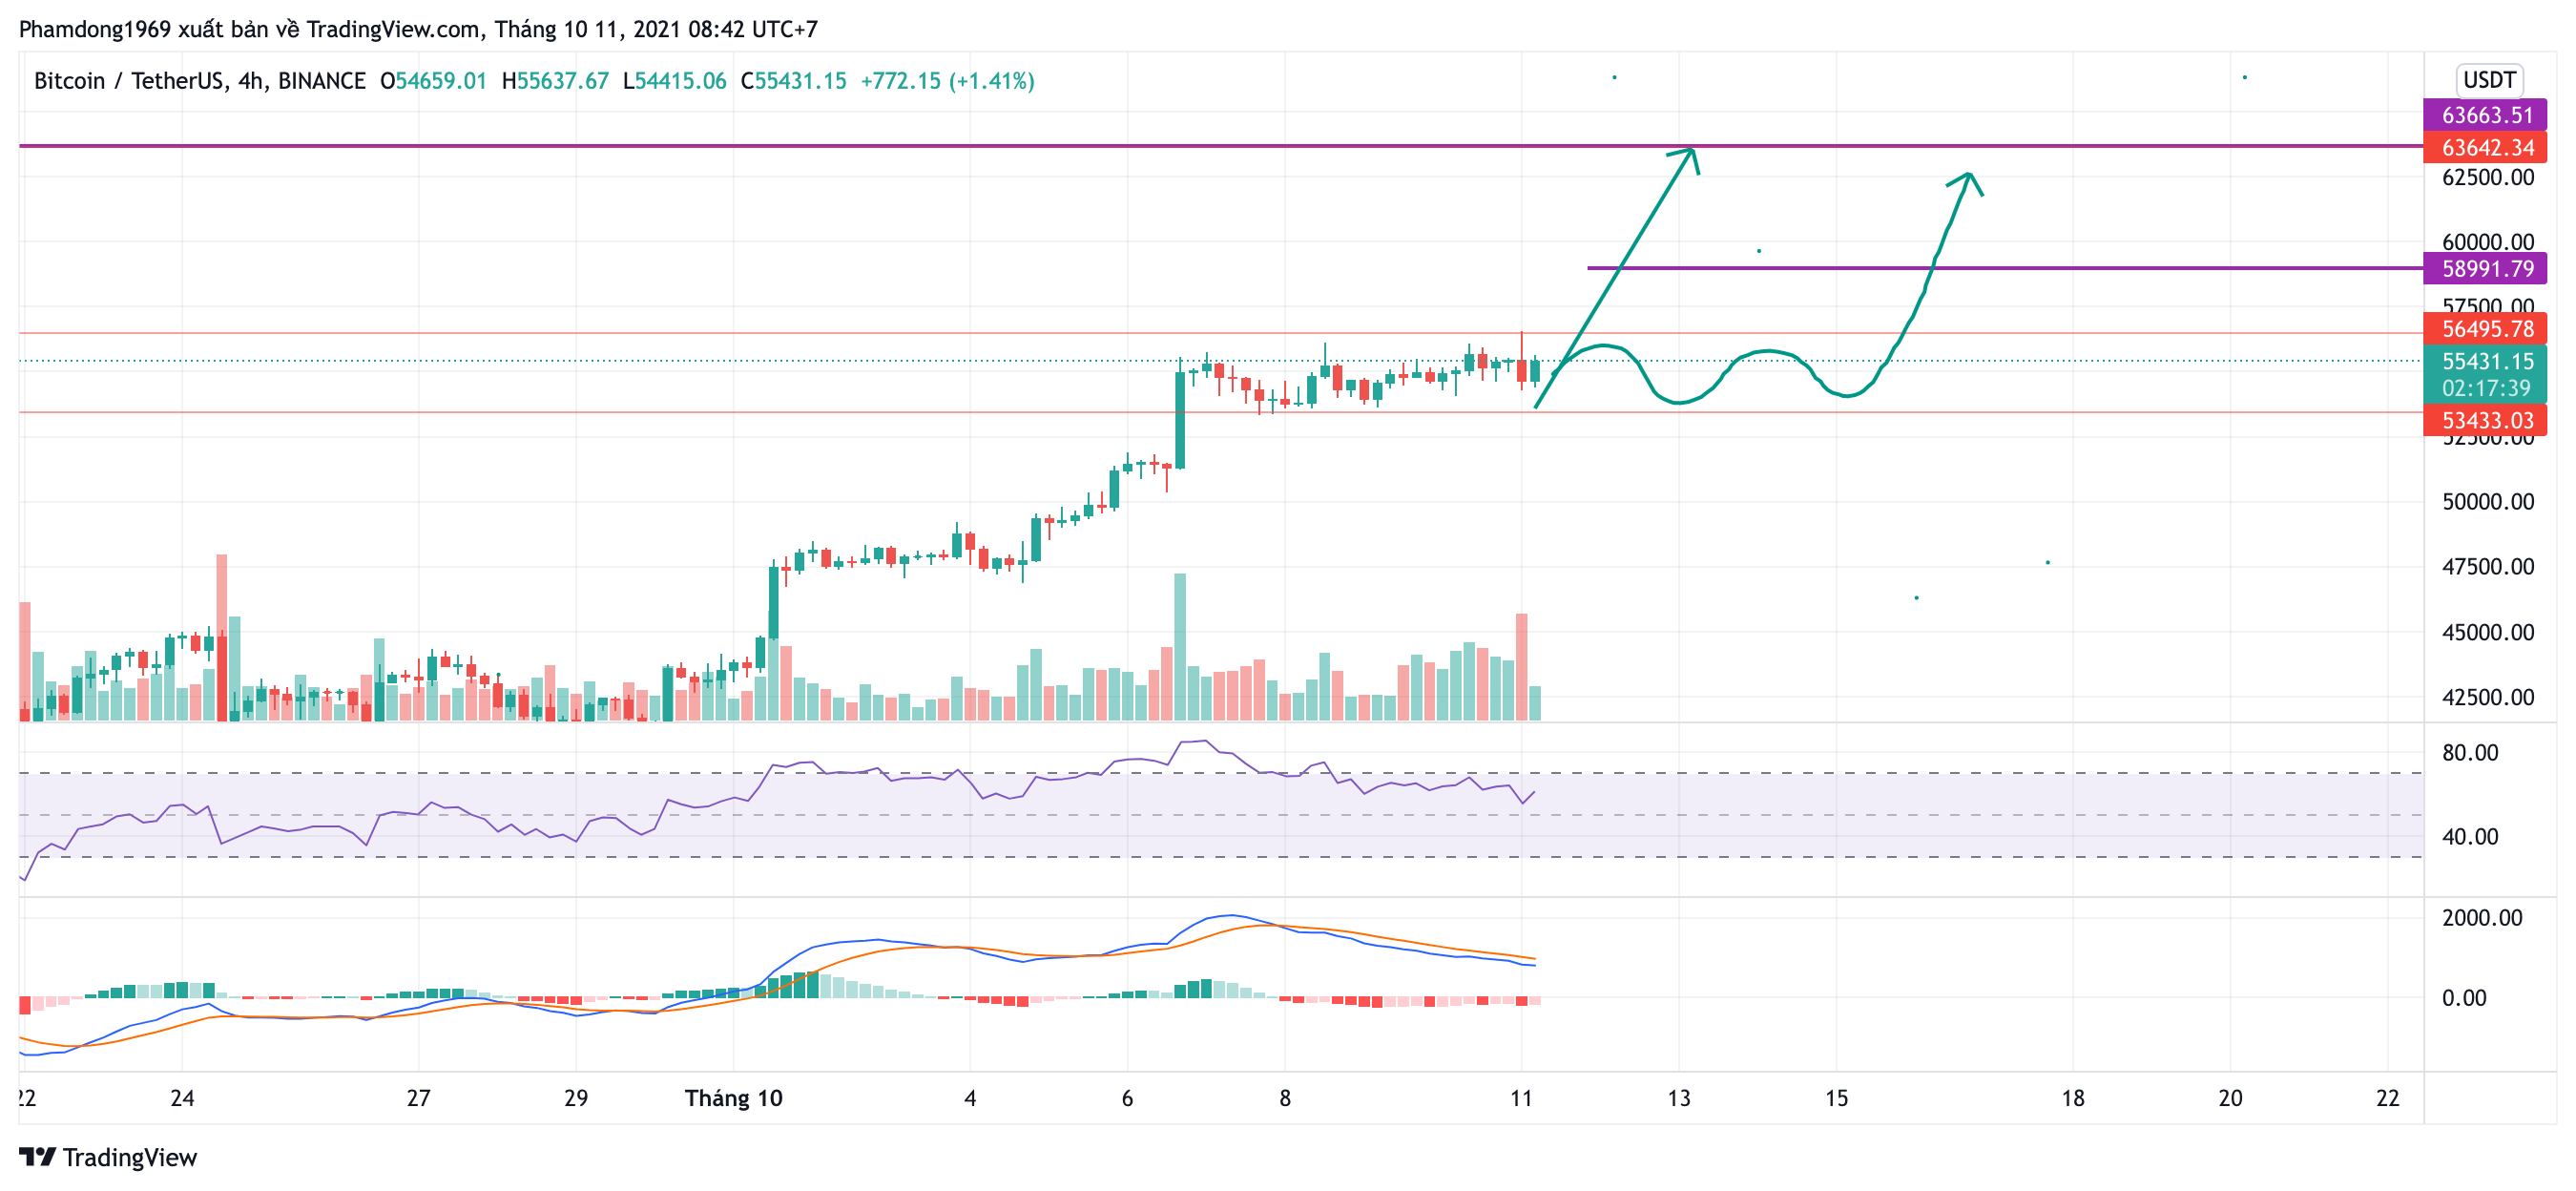
For the 4h chart, Bitcoin price is moving in a narrow range with the price range from $53.4k to $56.4k.
For the indicator, the MACD gives us a signal that the bears are not likely active. Therefore, we expect that Bitcoin price will break the resistance area at $56.4k and the BTC/USDT pair may rally to $59k. Above this level, a retest of the all-time high at $63.6k is possible.
Goodluck