Weekly Bitcoin Technical Analysis (Septemper 20th, 2021)
History for the week (From 13-19th-Sep, 2021)
Opening price: $46,025, closing price: $47,271 => Spread is $1246, up abou 2,7%).
Highest price: $48,843, lowest price $43,370 => Spread is $5473 (According to data from Binance exchange).
Technical Analysis
BTC/USDT weekly chart
BTC/USDT weekly chart — Tradingview
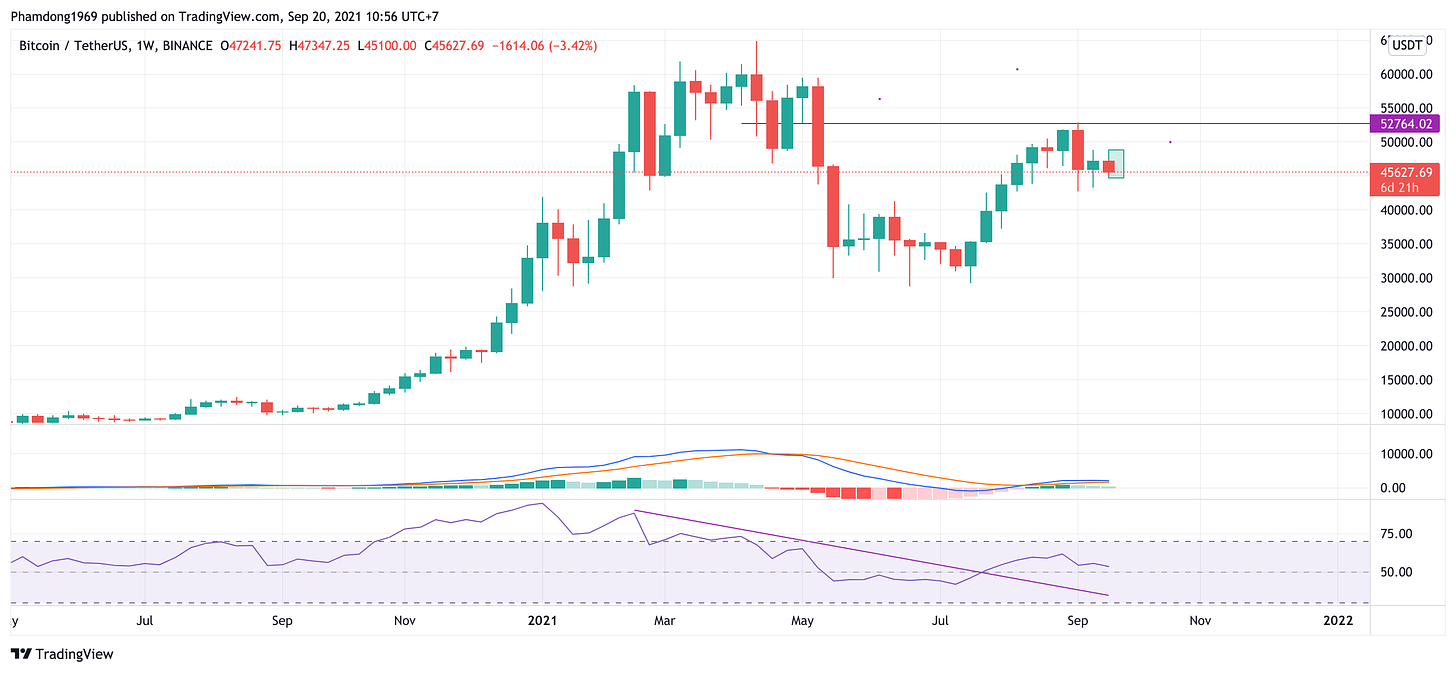
As the previous report, Bitcoin was witnessing a tough tussle between the bulls and the bears at $43,5k. The bulls finally had the upper hand, pushing the price to the price zone at 48,8k.
Last week's candle is a confirmation of the trend reversal of the previous week's candle. If Bitcoin price continues to form two green weekly candles and break above the resistance zone at 52,5k, we would expect the price to approach ATH again.
Conversely, if the price can not break this resistance level, it will suggest that the uptrend could be over.
BTC/USDT daily chart
BTC/USDT daily chart — Tradingview
On the daily chart, the indicators and candlestick patterns are showing that the bears are trying to sinking the price. However we still have a strong support zone at 42,9k in which MACD line touches the zero line.
If the bulls don’t again try to resume the up-move at this level, the BTC/USDT pair could slide to $37,5k and then to the breakout level at $29,4k.
BTC/USDT 4H chart
BTC/USDT daily chart — Tradingview
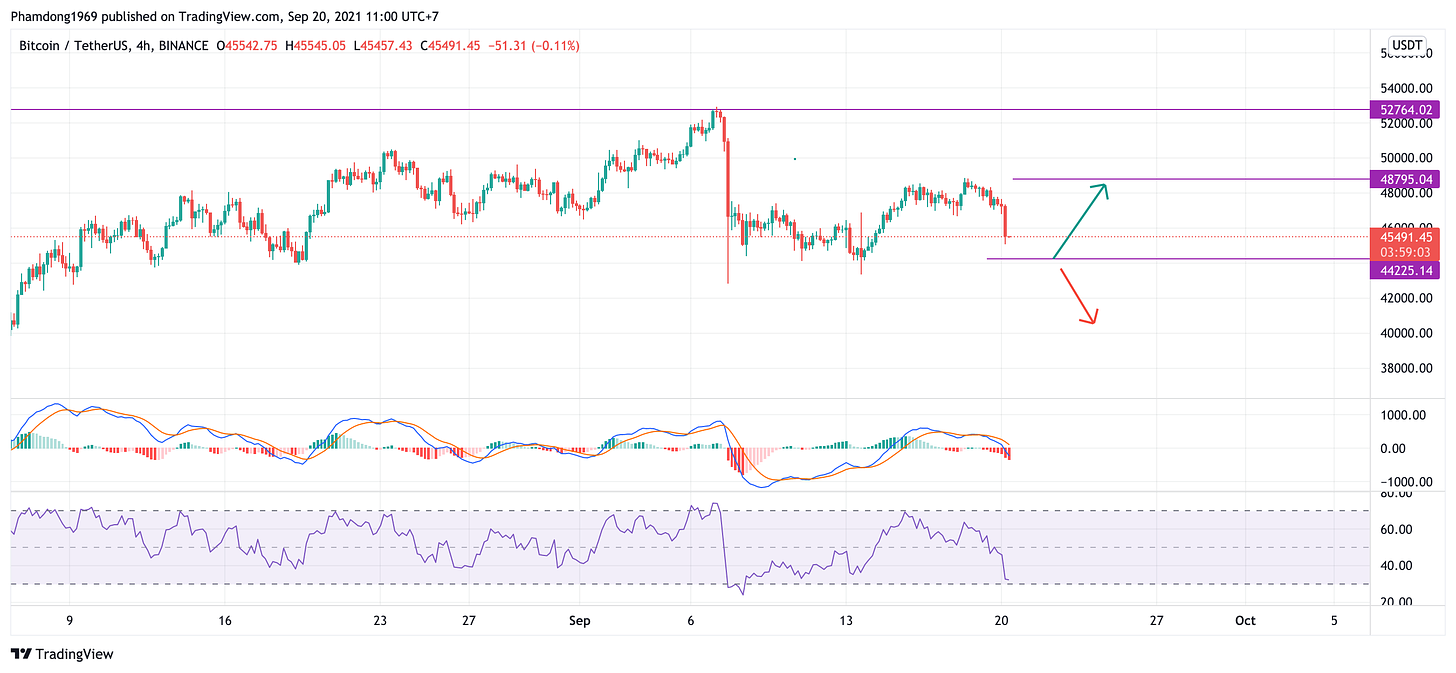
Similar to the daily chart, all indicators are bearish with RSI entering the oversold .If the price rebounds at 44,2k, the bulls will again push up to 48,7k. On the other hand, we will see the bear may be easy to sink the price to the lower price zones as we mentioned above.
Goodluck


