Weekly Bitcoin Technical Analysis (August 30th, 2021)
History for the week (From 23th to 29th August, 2021)
History for the week (From 23th to 29th August, 2021)
Opening price: $49,239, closing price: $48767 => Spread is $472, down about 0.96%).
Highest price: $46,250, lowest price $50,500 => Spread is $4250 (According to data from Binance exchange).
Technical Analysis
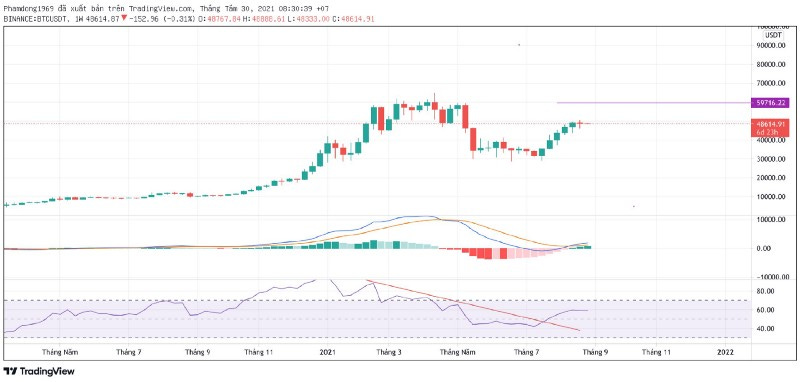
BTC/USDT weekly chart
Bitcoin price was a bearish and formed a doji candle last week. This is one of the first reversal signals after 5 consecutive bullish weeks. The indicators still show bullish trend with MACD has crossed the zero line for 3 weeks and RSI has broken the previous bearish trendline.
With the above analysis, we cannot conclude that the price will reverse in the long term. We’ll turn to daily chart to analysis the short-term direction of the Bitcoin price
BTC/USDT daily chart
There are two possible scenarios for Bitcoin price:
If the daily candle close above 49.5k, the bullish will prevail. The next price target is the resistance zone at 58k.
Conversely, if there is a daily candle that close below ~47.5k, Bitcoin price will correct in the short term. The adjusted prices will be at 44,6k, 41,9, 37,4k, respectively.
Goodluck


