


Weekly Bitcoin Technical Analysis (August 2nd, 2021)
History for the week (From 26th July to 1st August, 2021)

History for the week (From 26th July to 1st August, 2021)
Opening price: $35,381, closing price: $39,845 => Spread is $3620, up about 12.6%).
Highest price: $42,599, lowest price $35,205 => Spread is $7394 (According to data from Binance exchange).
Fundamental Analysis
We summarized some outstanding information from last week:
Negative news:
Executives at Tether, world’s third largest cryptocurrency, reportedly face criminal probe for misleading banks
Binance banned in Malaysia, given 14 days notice to shut down operations
Switzerland’s largest bank UBS warned that clients have crypto FOMO
Positive news:
Paypal to expand Bitcoin buying to UK, says, wallet withdrawls in progress
Analysts discuss Bitcoin Over-the-Counter Desks bubbling with BTC demand.
Germany to allow institutional funds to hold up to 20% in crypto
Technical Analysis
BTC/USDT weekly chart
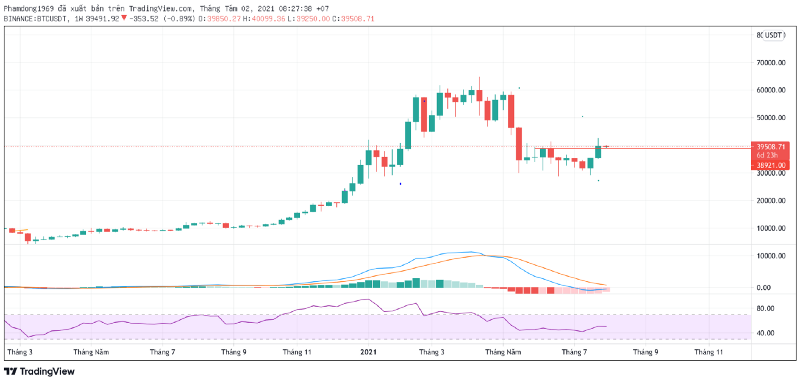
Based on long-term trend, Bitcoin price just had a relatively strong week of recovery. The weekly candle closed above the previous resistance (~39k). The downtrend is still dominant, it’s just a rally. We cannot rely on the current price reaction to determine whether the main trend has reversed or not.
BTC/USDT daily chart
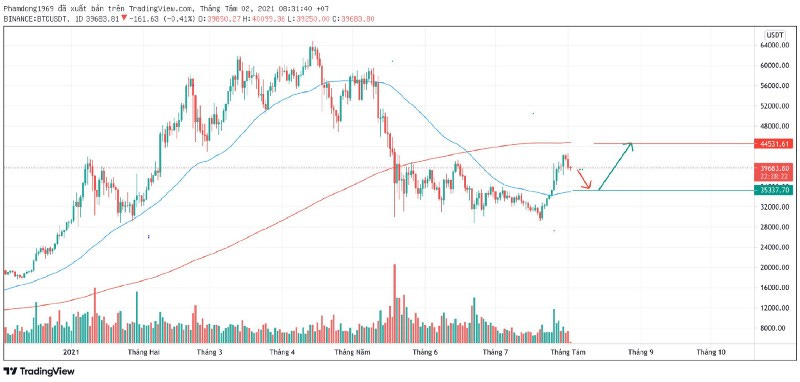
In the daily chart, there have been 8 consecutive bullish days. In the last three days, the price formed a bearish candlestick pattern(Evening Star). Based on the candlestick counting method, after the appearance of 7–9 bullish candles, there will be 4 bearish candles. That’s why maybe the next 2 days will be 2 days of Bitcoin’s price drop.
In terms of technical indicators, we can identify resistance (~35k) and support (~44,5k) areas as MA 50 (blue line) and MA 200 (redline), respectively. We expect the price will move like the arrow in the daily chart.
To minimize the risk, we should wait for next 2 days until there are reversal signals, then we’ll re-enter the market.
Goodluck!