Weekly Bitcoin Technical Analysis (August 16th, 2021)
History for the week (From 9th to 16th August, 2021)
History for the week (From 9th to 16th August, 2021)
Opening price: $43,794, closing price: $46,973 => Spread is $3179, up about 7.3%).
Highest price: $48,144, lowest price $42,779 => Spread is $5365 (According to data from Binance exchange).
Fundamental Analysis
We summarized some outstanding information from last week:
Negative news:
The US infrastructure bill impacts cryptocurrency. On social media, there are many claims about the bill “crushing” or “killing” cryptocurrency.
Positive news:
Crypto-friendly bank backed by Warren Buffett’s Berkshire Hathaway plans $2 billion IPO on Nasdaq.
AMC, the US cinema chain that owns Odeon, says it will allow customers to pay for movie tickets and concessions in Bitcoin by the end of the year.
Technical Analysis
BTC/USDT weekly chart
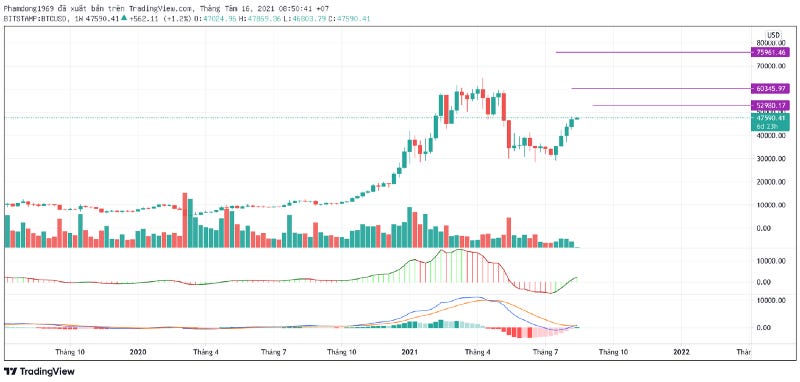
Bitcoin price continued to increase in the past week with many positive signals of the weekly chart. Notably, the MACD has crossed the zero line for the second week which is a bullish signal in the long-term of Bitcoin. The next resistance levels will be ~ 52k, 60k, 75k, 120k, respectively.
BTC/USDT daily chart
To move above next price target at 52k, Bitcoin price needs to break previous resistance ($48,144) for the daily chart. Notably, RSI indicator is making a lower high than the previous one while the price is incresing. However, the bullish scenario still prevails because the price formed a doji candle yesterday.
The moving averages (MA) are also giving long term buy signal for the Bitcoin price. MA 13, M34, MA89 are stacked on top of each other in order from high to low.
Goodluck


