

Weekly Bitcoin Technical Analysis (October 25th, 2021)
Weekly Bitcoin Technical Analysis (October 25th, 2021)


History for the week (From 18-24th/Oct, 2021)
Opening price: $61,528, closing price: $60,852 => Spread is $676, down about 1%).
Highest price: $67,000, lowest price $59,510 => Spread is $7490 (According to data from Binance exchange).
Technical Analysis
BTC/USDT weekly chart
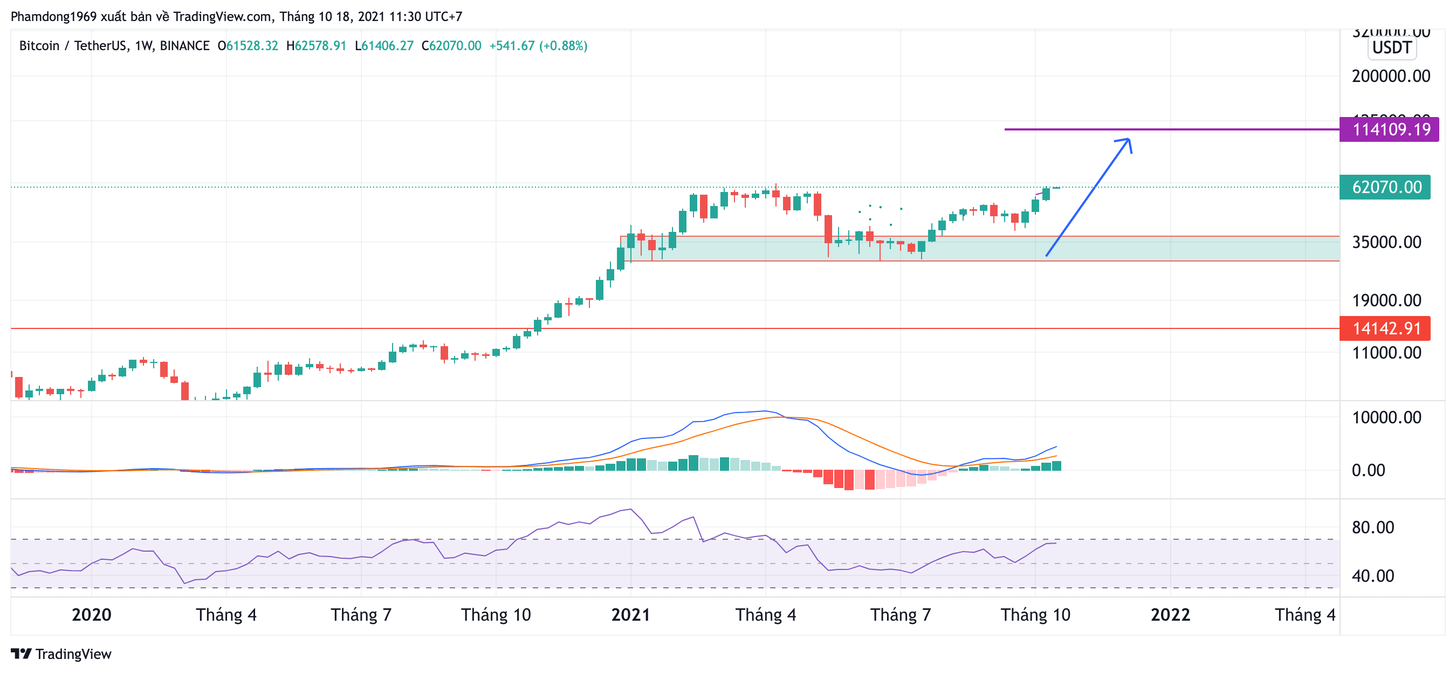
An inverted hammer was formed on the weekyly chart. This is a candlestick that reinforces the trend. It means that after last week's candle, the Bitcoin price will form 1 or 2 bearish correction candles then price will go up again. To determine this week's price range in the short-term, we will turn to analysis on the daily chart.
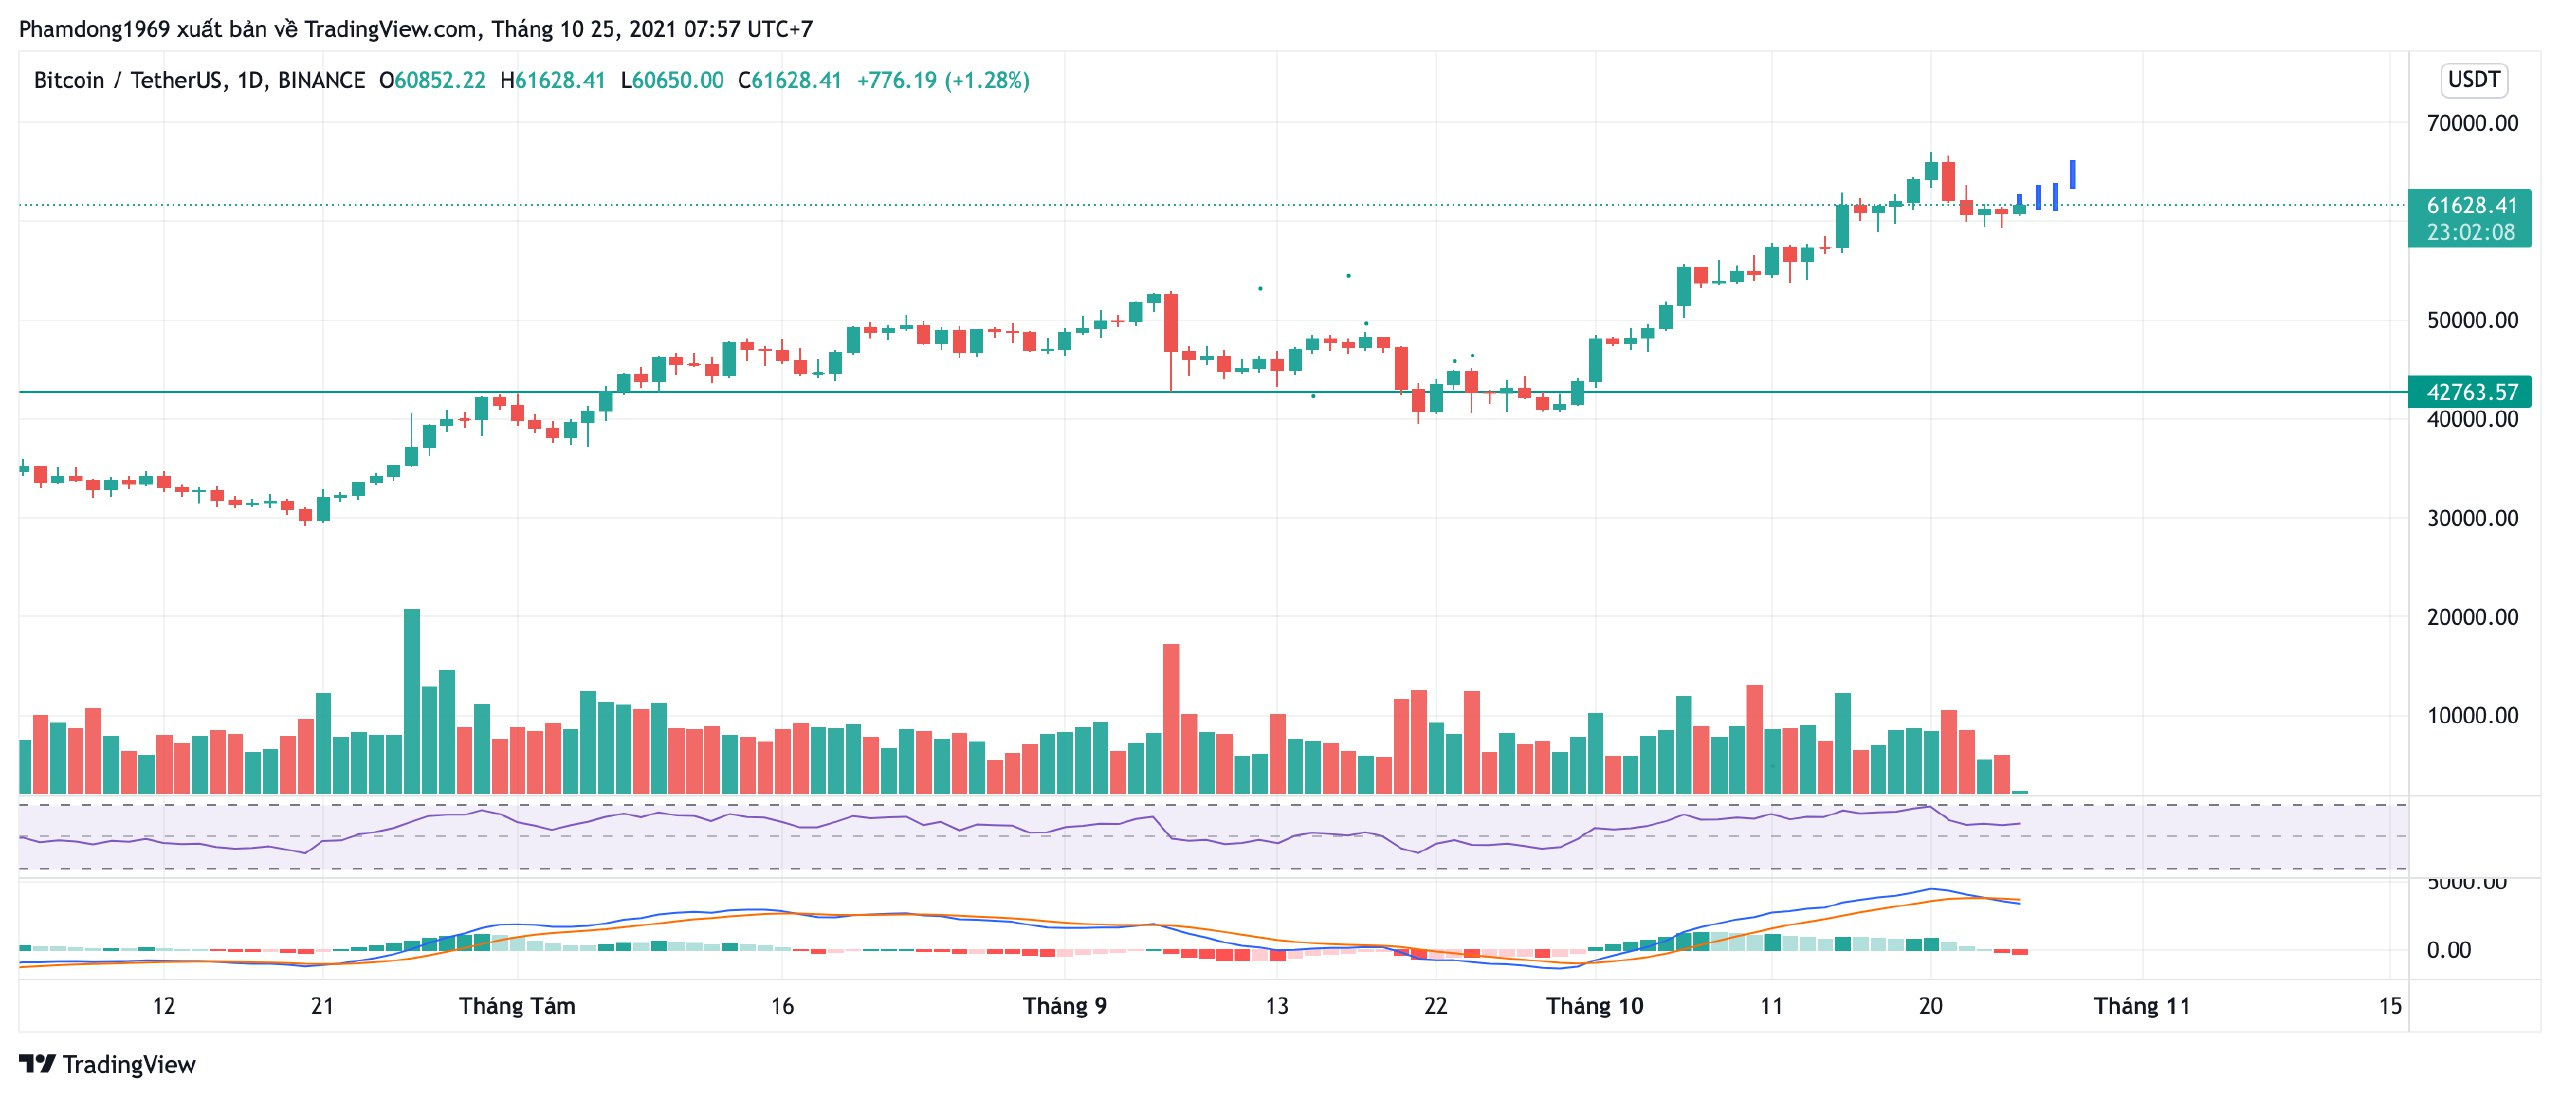
BTC/USDT daily chart
On the daily chart, the bears no longer have the upper hand after the hard drop on 21th Oct. Until now, the Bitcoin price has not had a clear signal to clearly identify the short-term trend, although it is still an uptrend on the weekly chart.
There will be 2 possibilities for the BTC/USDT pair this week:
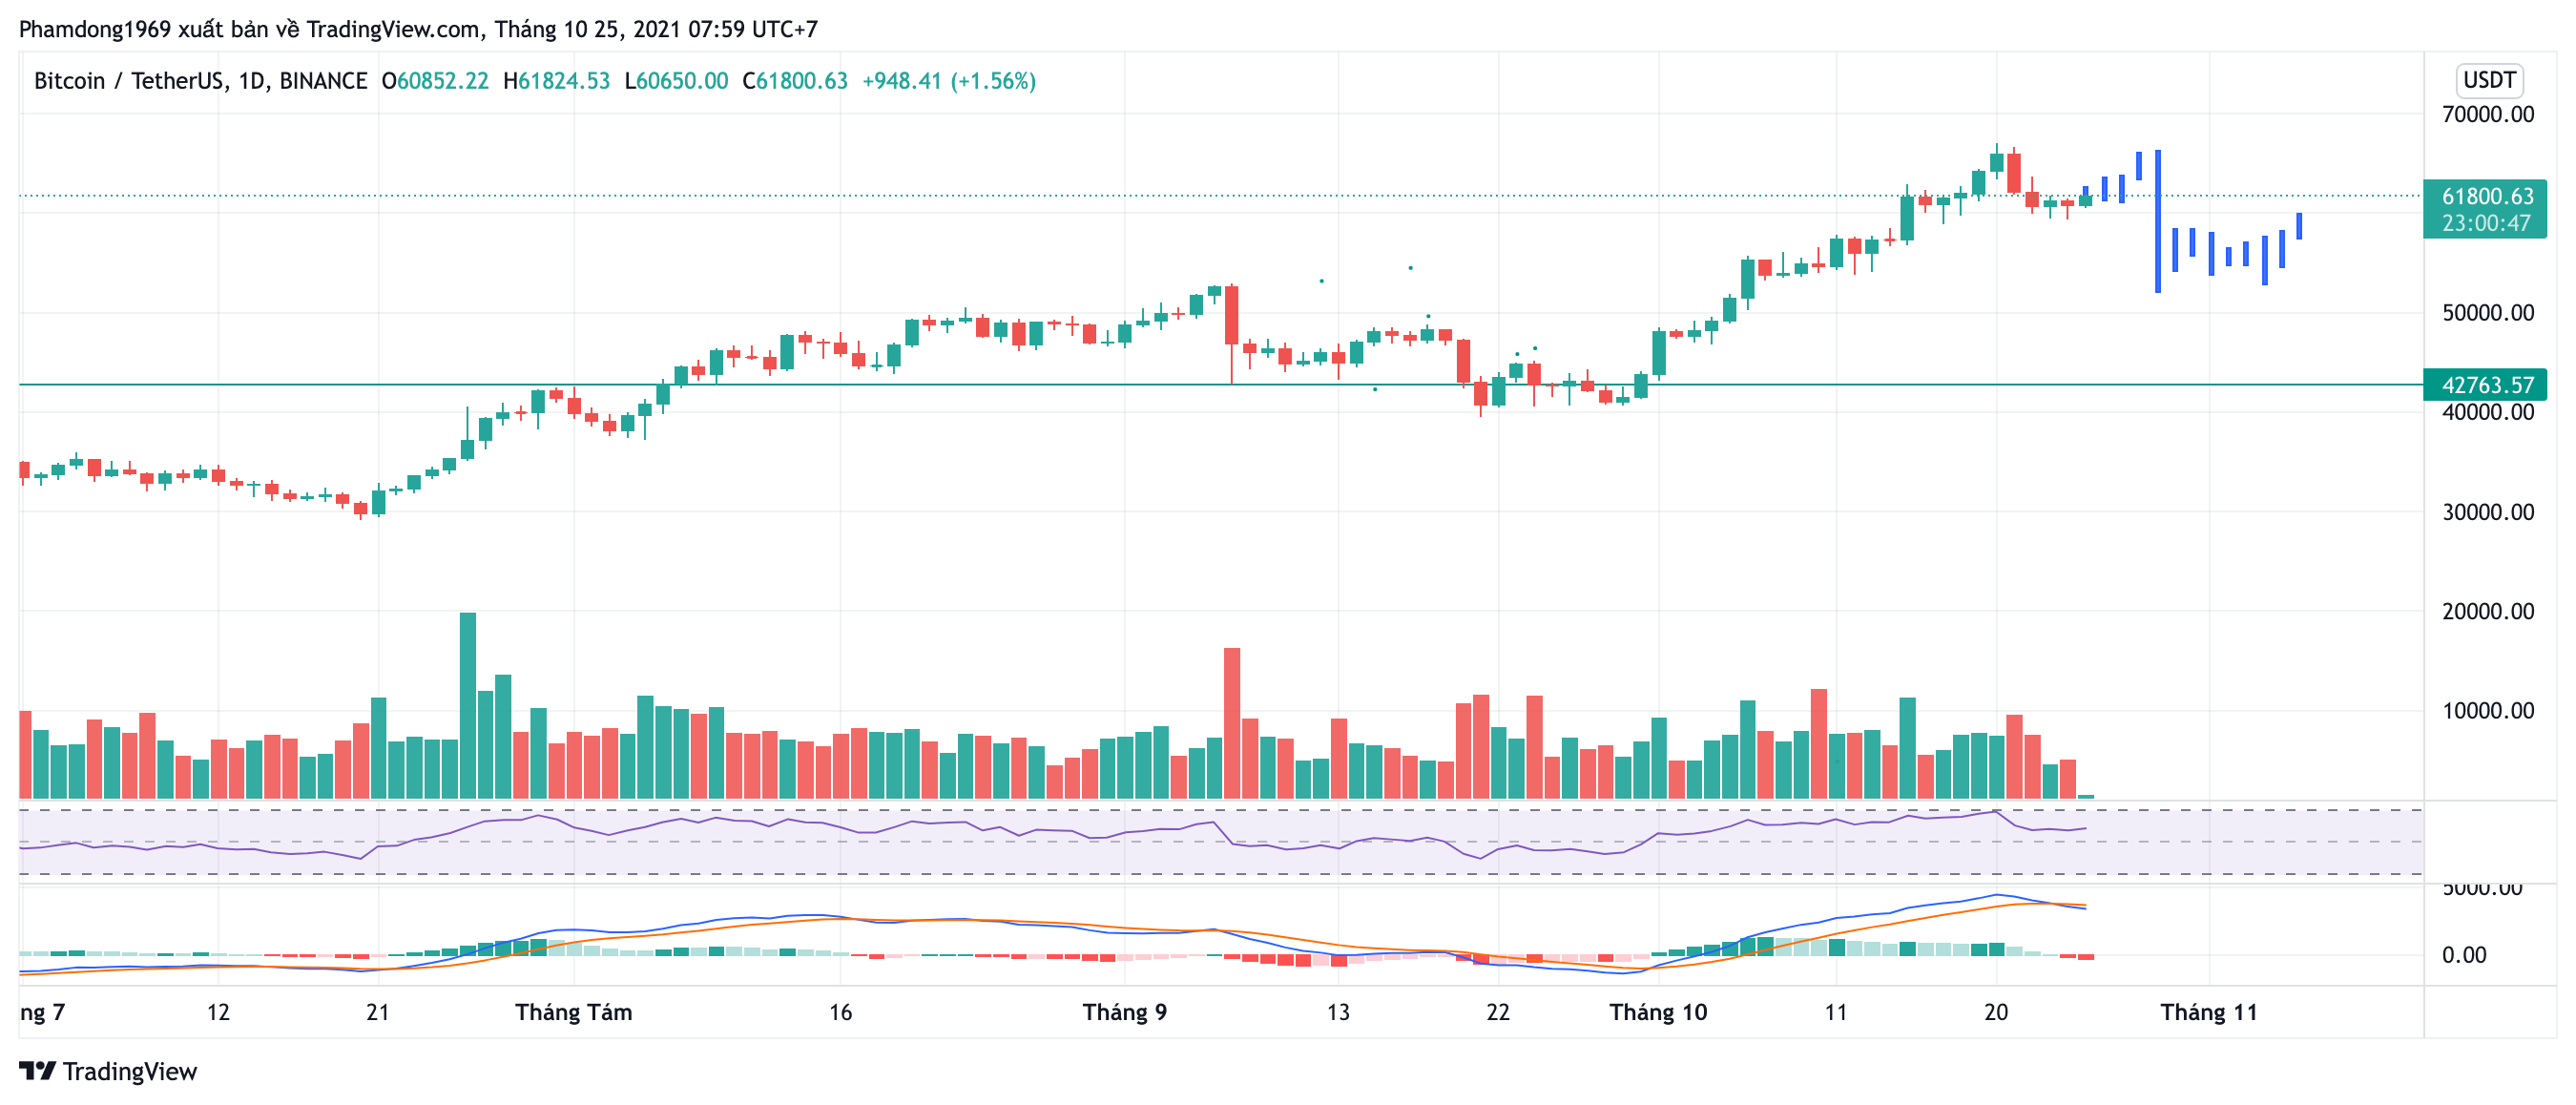
Situation 1: In the next few days, the bull is likely to rise to the price area ($66k to $67k) then will turn down to in the $51k-$54k zone and move sideway in a few weeks (3-4 weeks). This is a bad scenario for Bitcoin price in particular and the altcoin market in general.
Situation 2: Bitcoin price will not occur a downward correction but will move sideways in the price range of $60k to $61k. The bulls will then push the price to the all-time high levels.
Goodluck