


Weekly Bitcoin Technical Analysis (November 8th, 2021)


History for the week (From 1st-7th/Nov, 2021)
Opening price: $61,299, closing price: $63,273 => Spread is $1974, down about 3.2%).
Highest price: $64,270, lowest price $59,405 => Spread is $4865 (According to data from Binance exchange).
Technical Analysis
BTC/USDT weekly chart
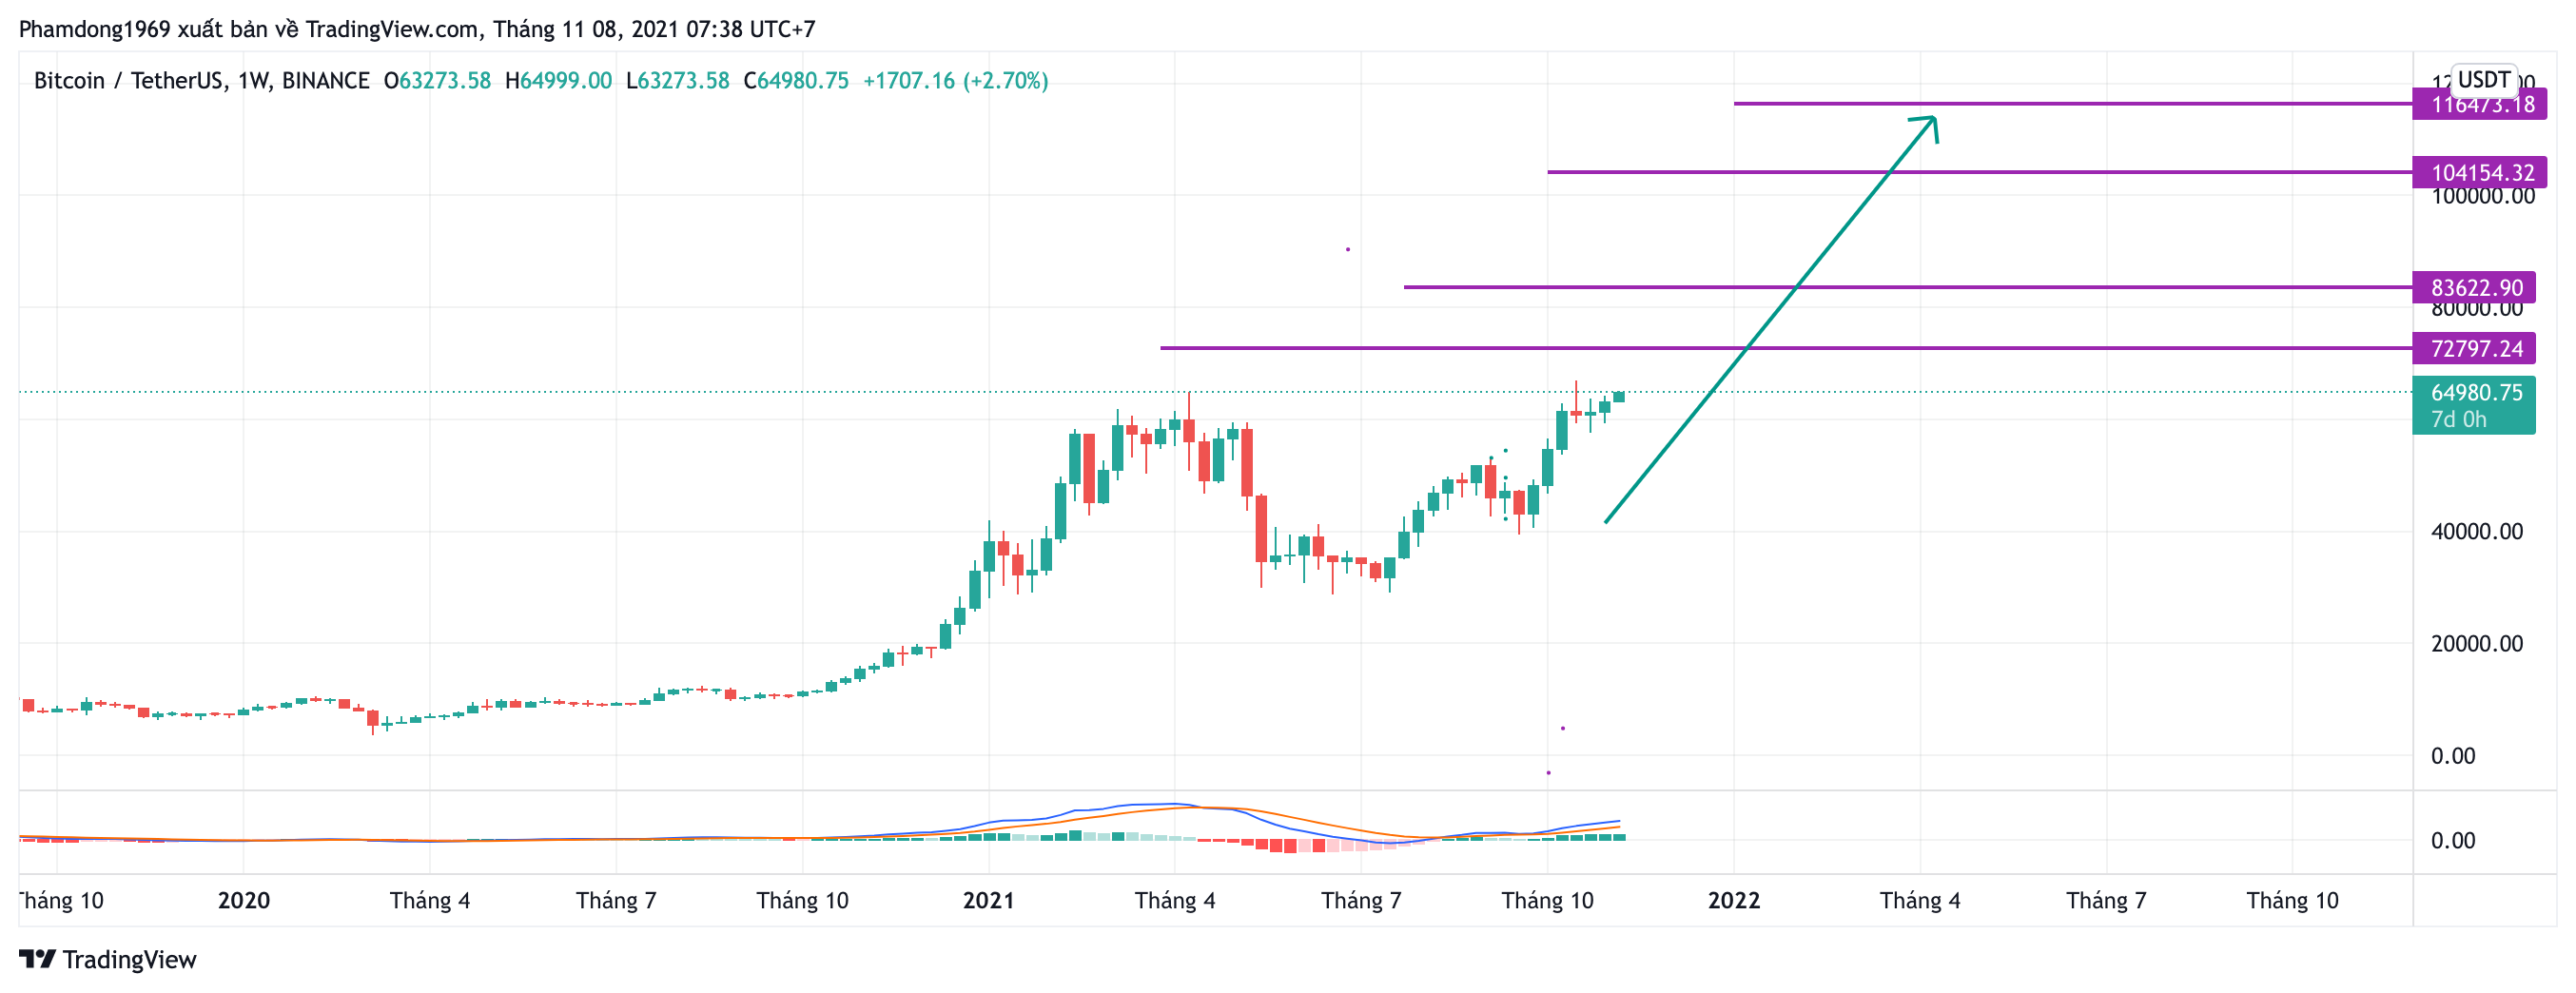
BTCUSDT pair closed at $63,27 that has surpassed last three week's closing price. This further reinforces the sustainable uptrend for Bitcoin. The Bitcoin price is likely to surge this week with a price target at $67,000, $72,797 respectively.
BTC/USDT daily chart
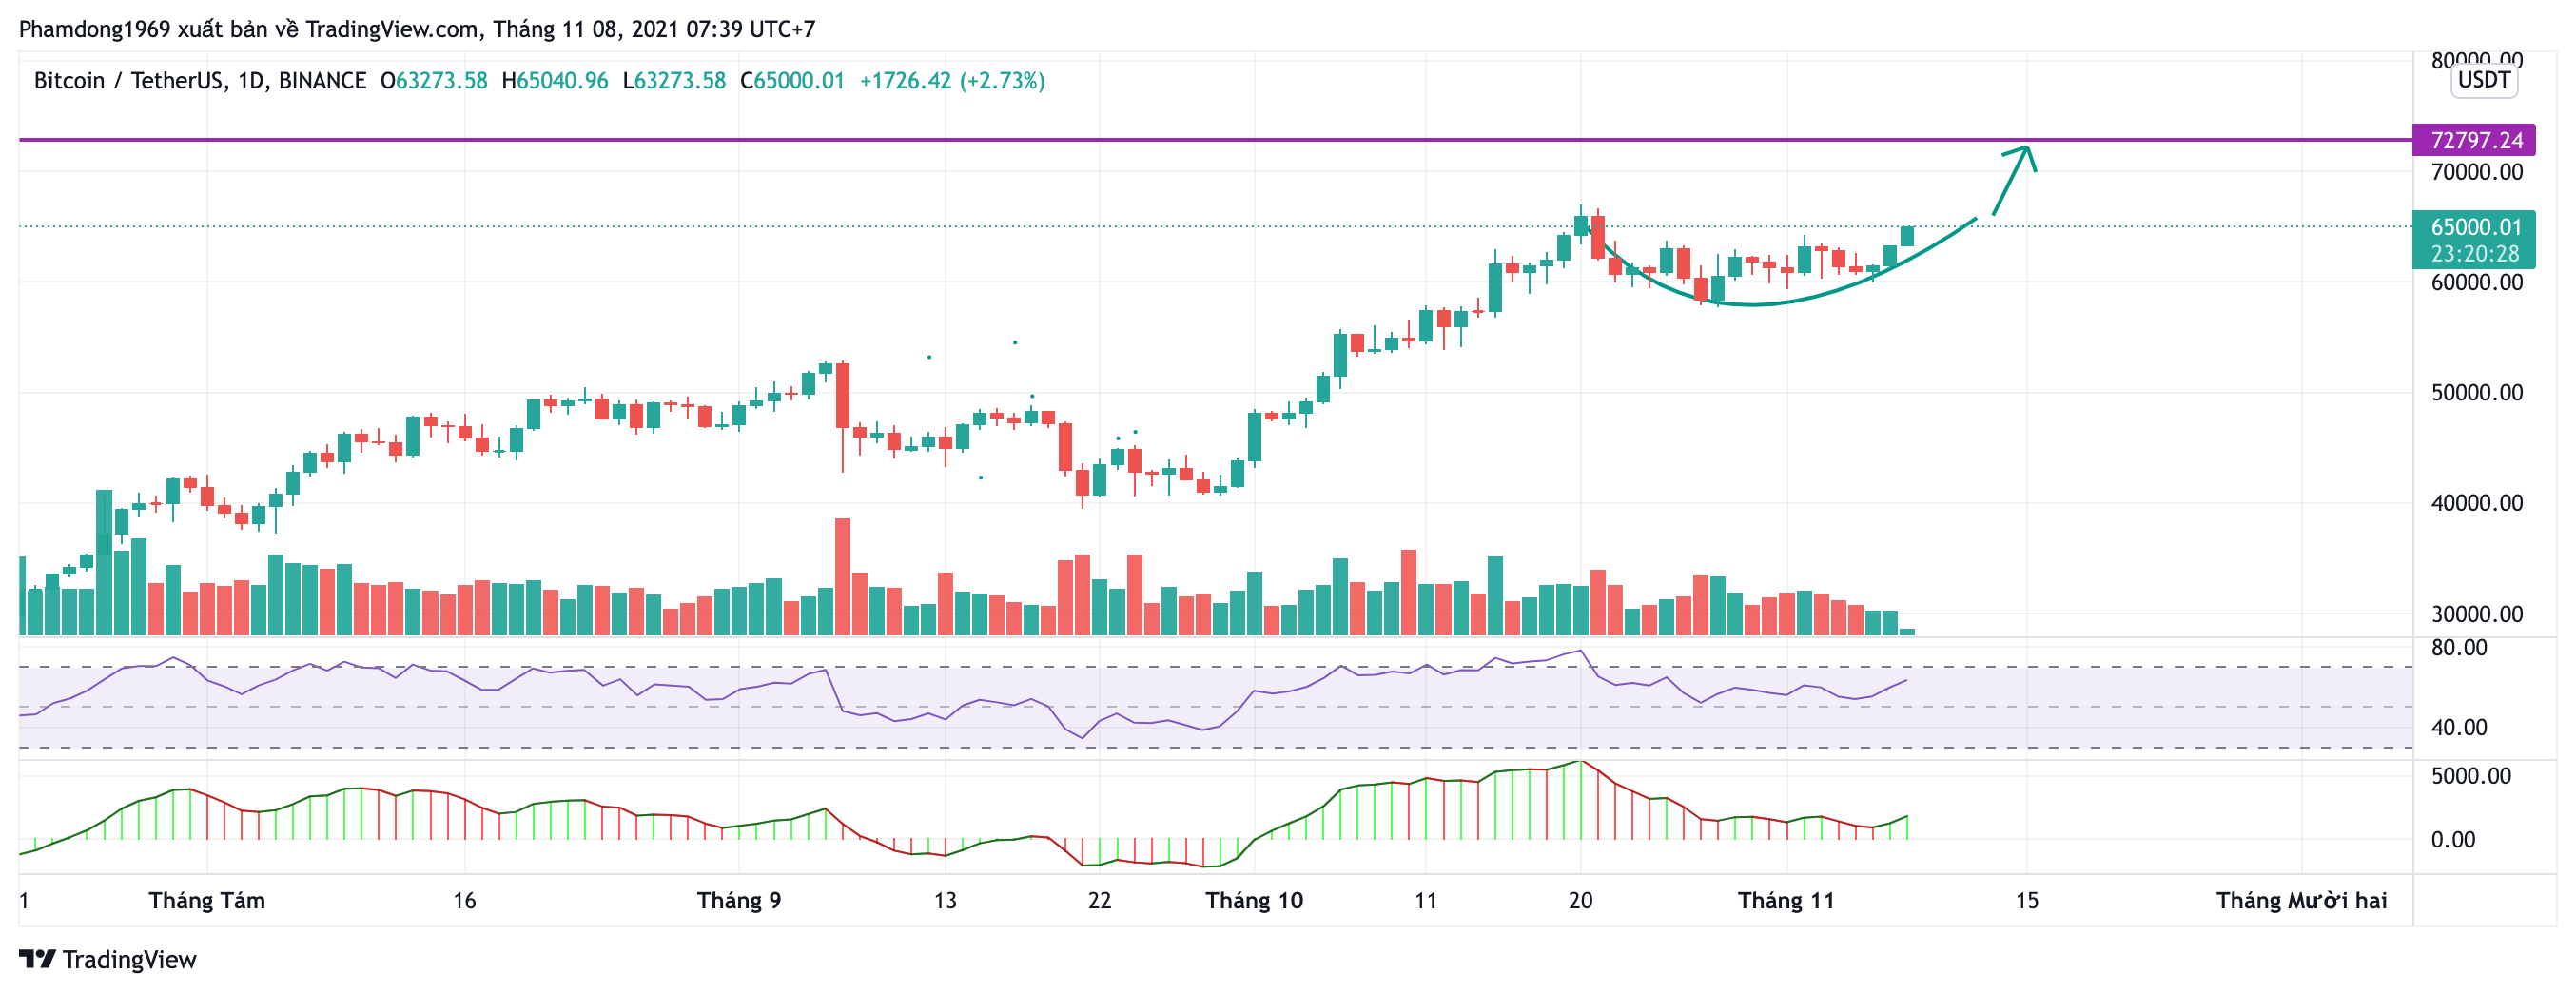
On the daily chart, Bitcoin price rallied at the weekend after moving sideways at the beginning of the week. As mentioned above, the Bitcoin price will soon reach the all-time high ($72K) this week.
Goodluck