Weekly Bitcoin Technical Analysis (Septemper 27th, 2021)
History for the week (From 20-26th-Sep, 2021)
Opening price: $47,241, closing price: $43,160 => Spread is $4081, down about 8,6%).
Highest price: $47,347, lowest price $39,600 => Spread is $7747 (According to data from Binance exchange).
Technical Analysis
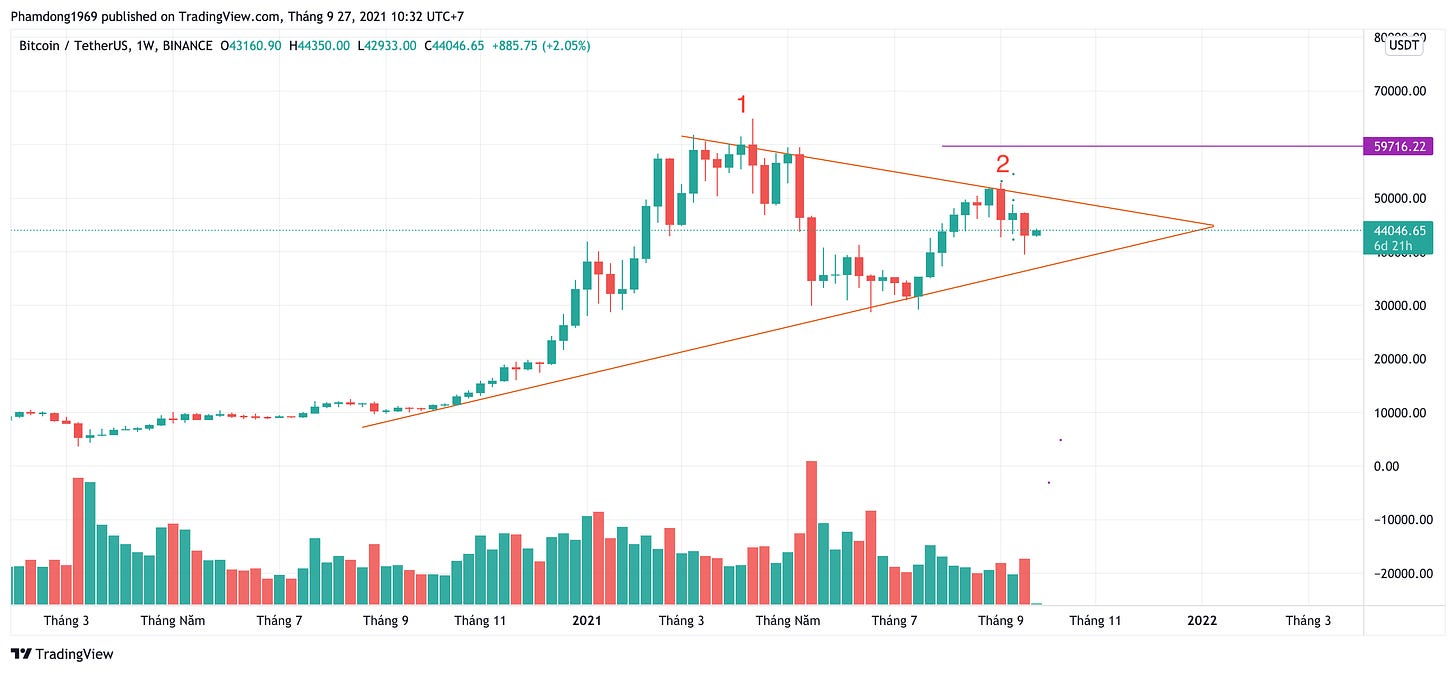
BTC/USDT weekly chart
BTC/USDT weekly chart — Tradingview
On weekly chart,Bitcoin price is forming a Symmetrical Triangle Pattern pattern.This week's closing price that plays an important role in determining the next long-term trend. If the pulls push the price closes above $47,2k and MACD diverge from zero line, the BTC/USDT could climb to $52k. Conversely, if the price turns down and closes belove 43,2k, the bears will try to sink the price the to the lower edge of the triangle (~36,1k). A violation of this zone may indicate the start of a downtrend.
BTC/USDT daily chart
BTC/USDT daily chart — Tradingview
Looking at the daily chart, the Bitcoin price is forming a bearish channel and it is approaching the upper edge of the channel. If the price break above the critical resistance zone at $45k, the price target will be expected at $48,8k, $52,8k respectively. Conversely, this bullish view will invalidate if the price turns down, it can drop to ~36k.
Goodluck


