


Weekly Bitcoin Technical Analysis (November 15th, 2021)


History for the week (From 8-14th/Nov, 2021)
Opening price: $63,273, closing price: $65,519 => Spread is $2246, up about 3.5%).
Highest price: $69,000, lowest price $62,278 => Spread is $6722 (According to data from Binance exchange).
Technical Analysis
BTC/USDT weekly chart
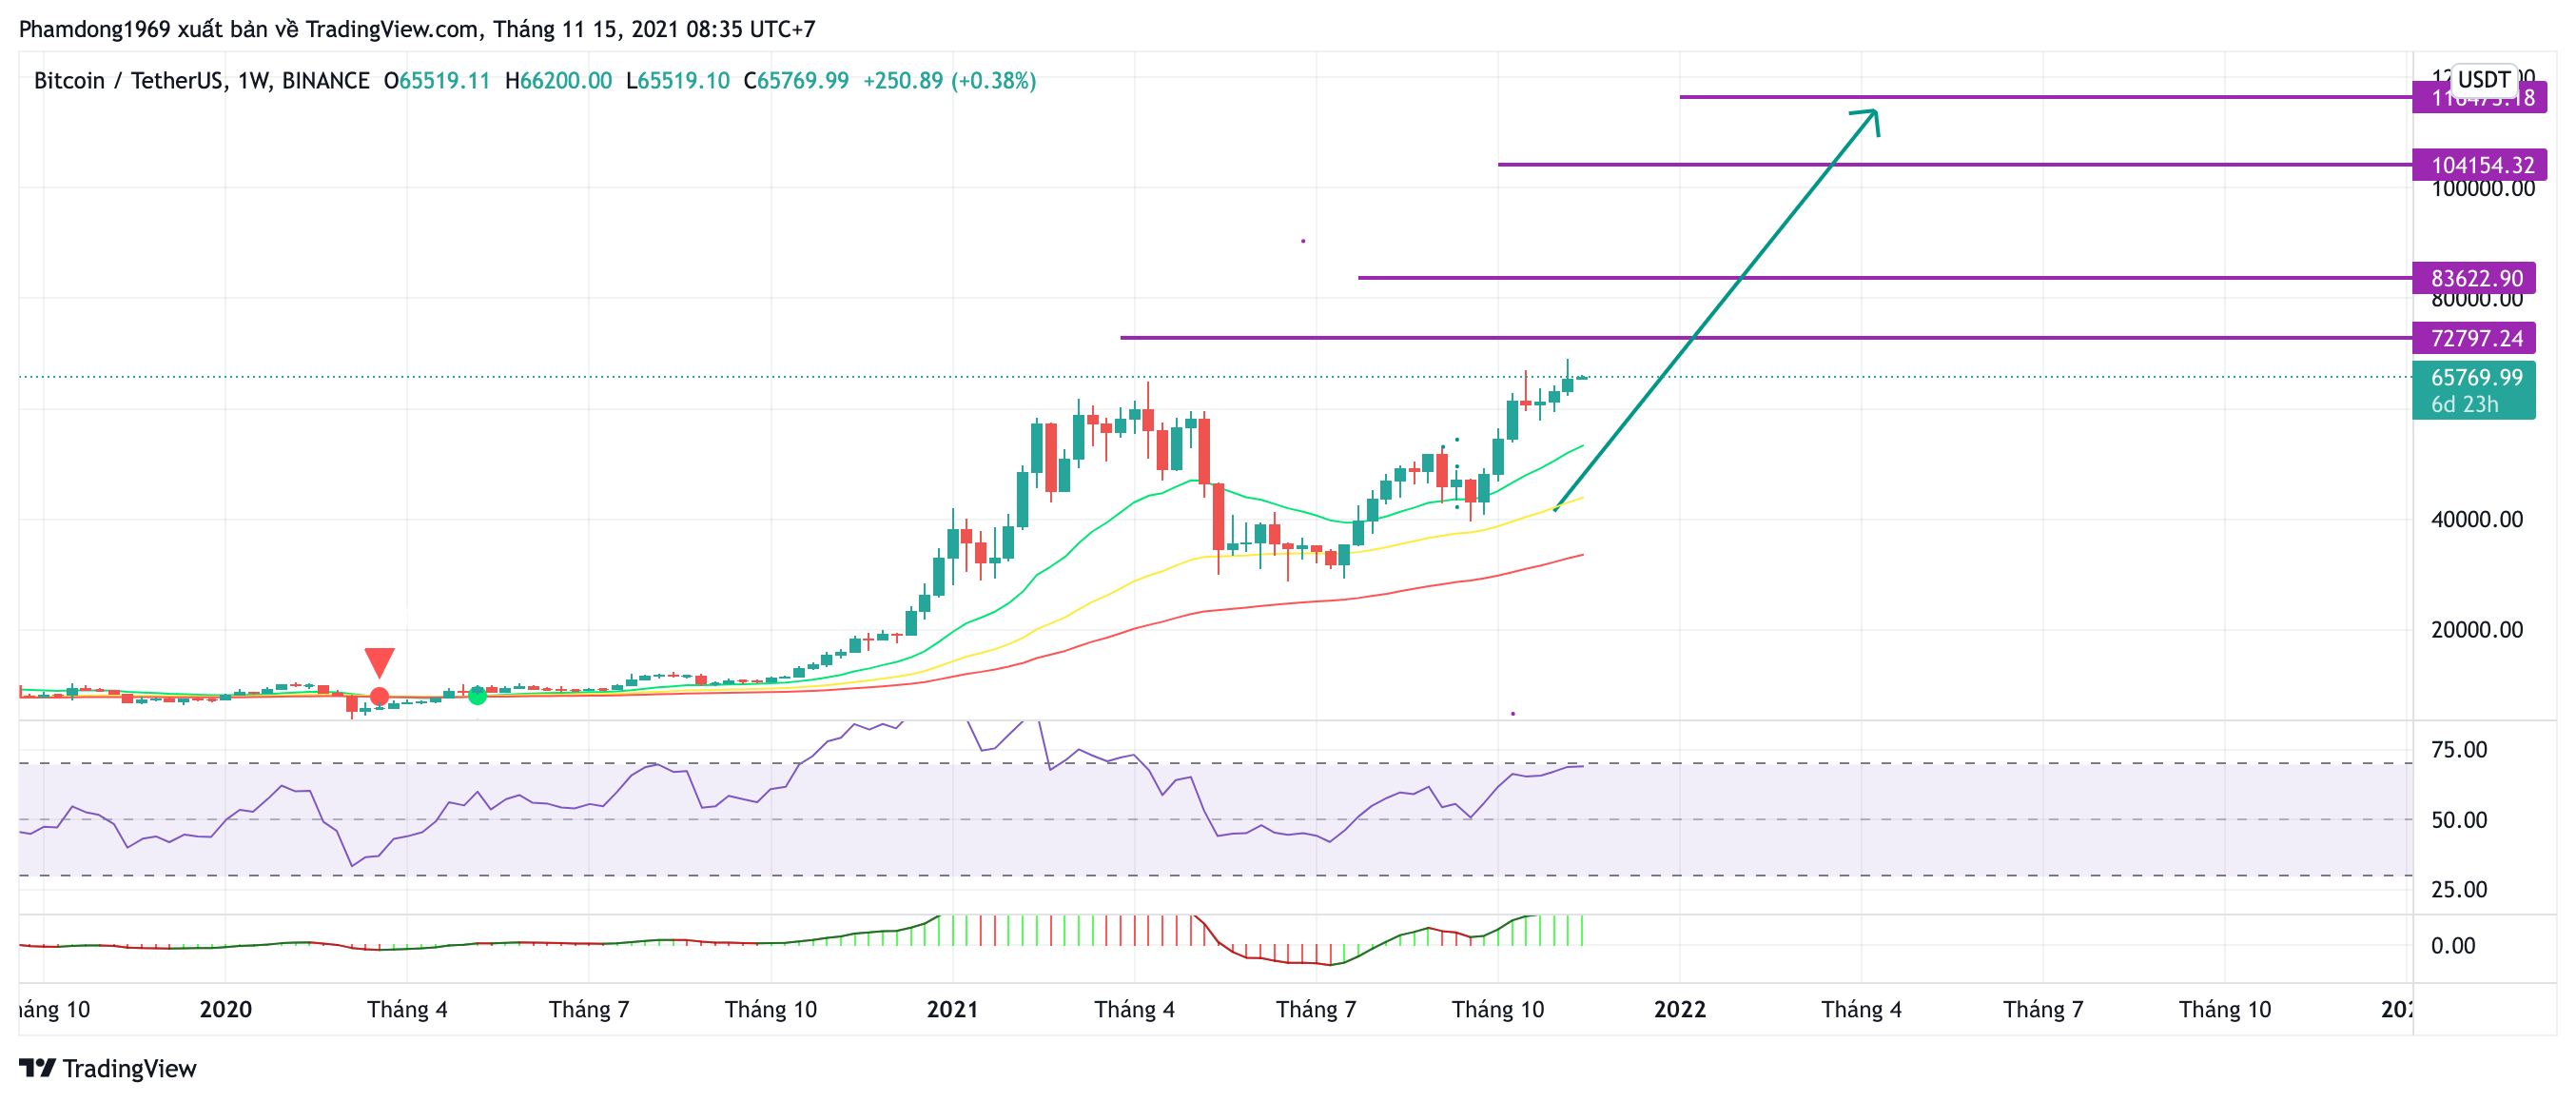
As the analysis in previous weeks, we still hold the view that Bitcoin will rally to new ATH levels at $72k, $83k, $104k,$116k respectively. To determine the short-term price trend, we will turn to the daily chart.
BTC/USDT daily chart
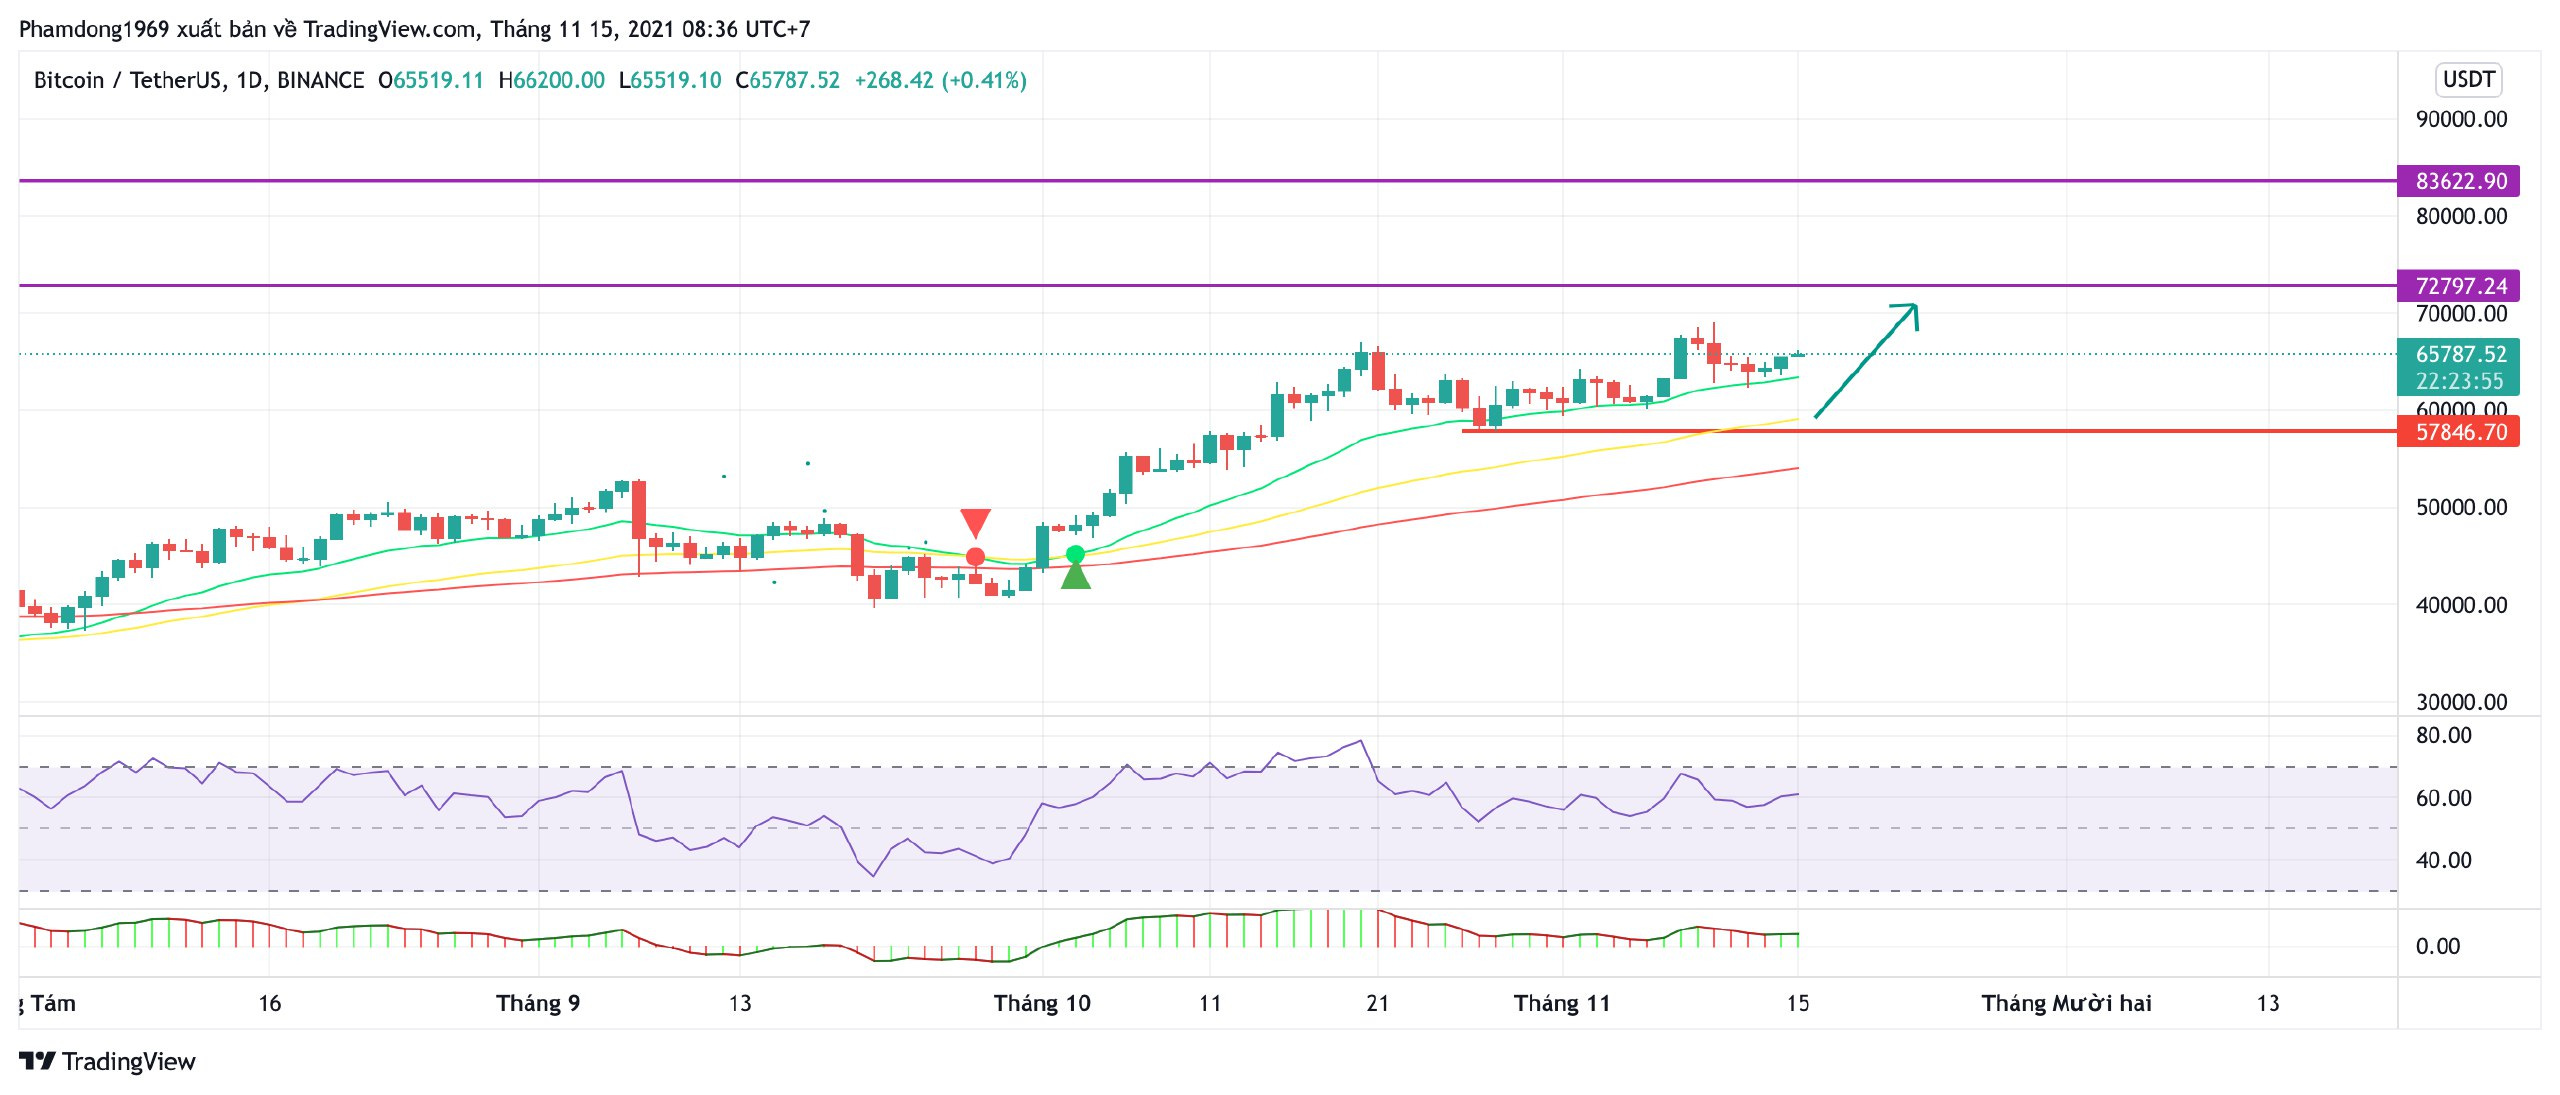
The chart shows that the pair has a strong support zone at $57,8k. The bulls are still largely dominant and it could push the price to higher level at 73k this week.
Alternatively, a break and close below the support level at $57,8k that traders may be rushing to the exit. It could signal the start of a deeper correction to $52k - $50k.
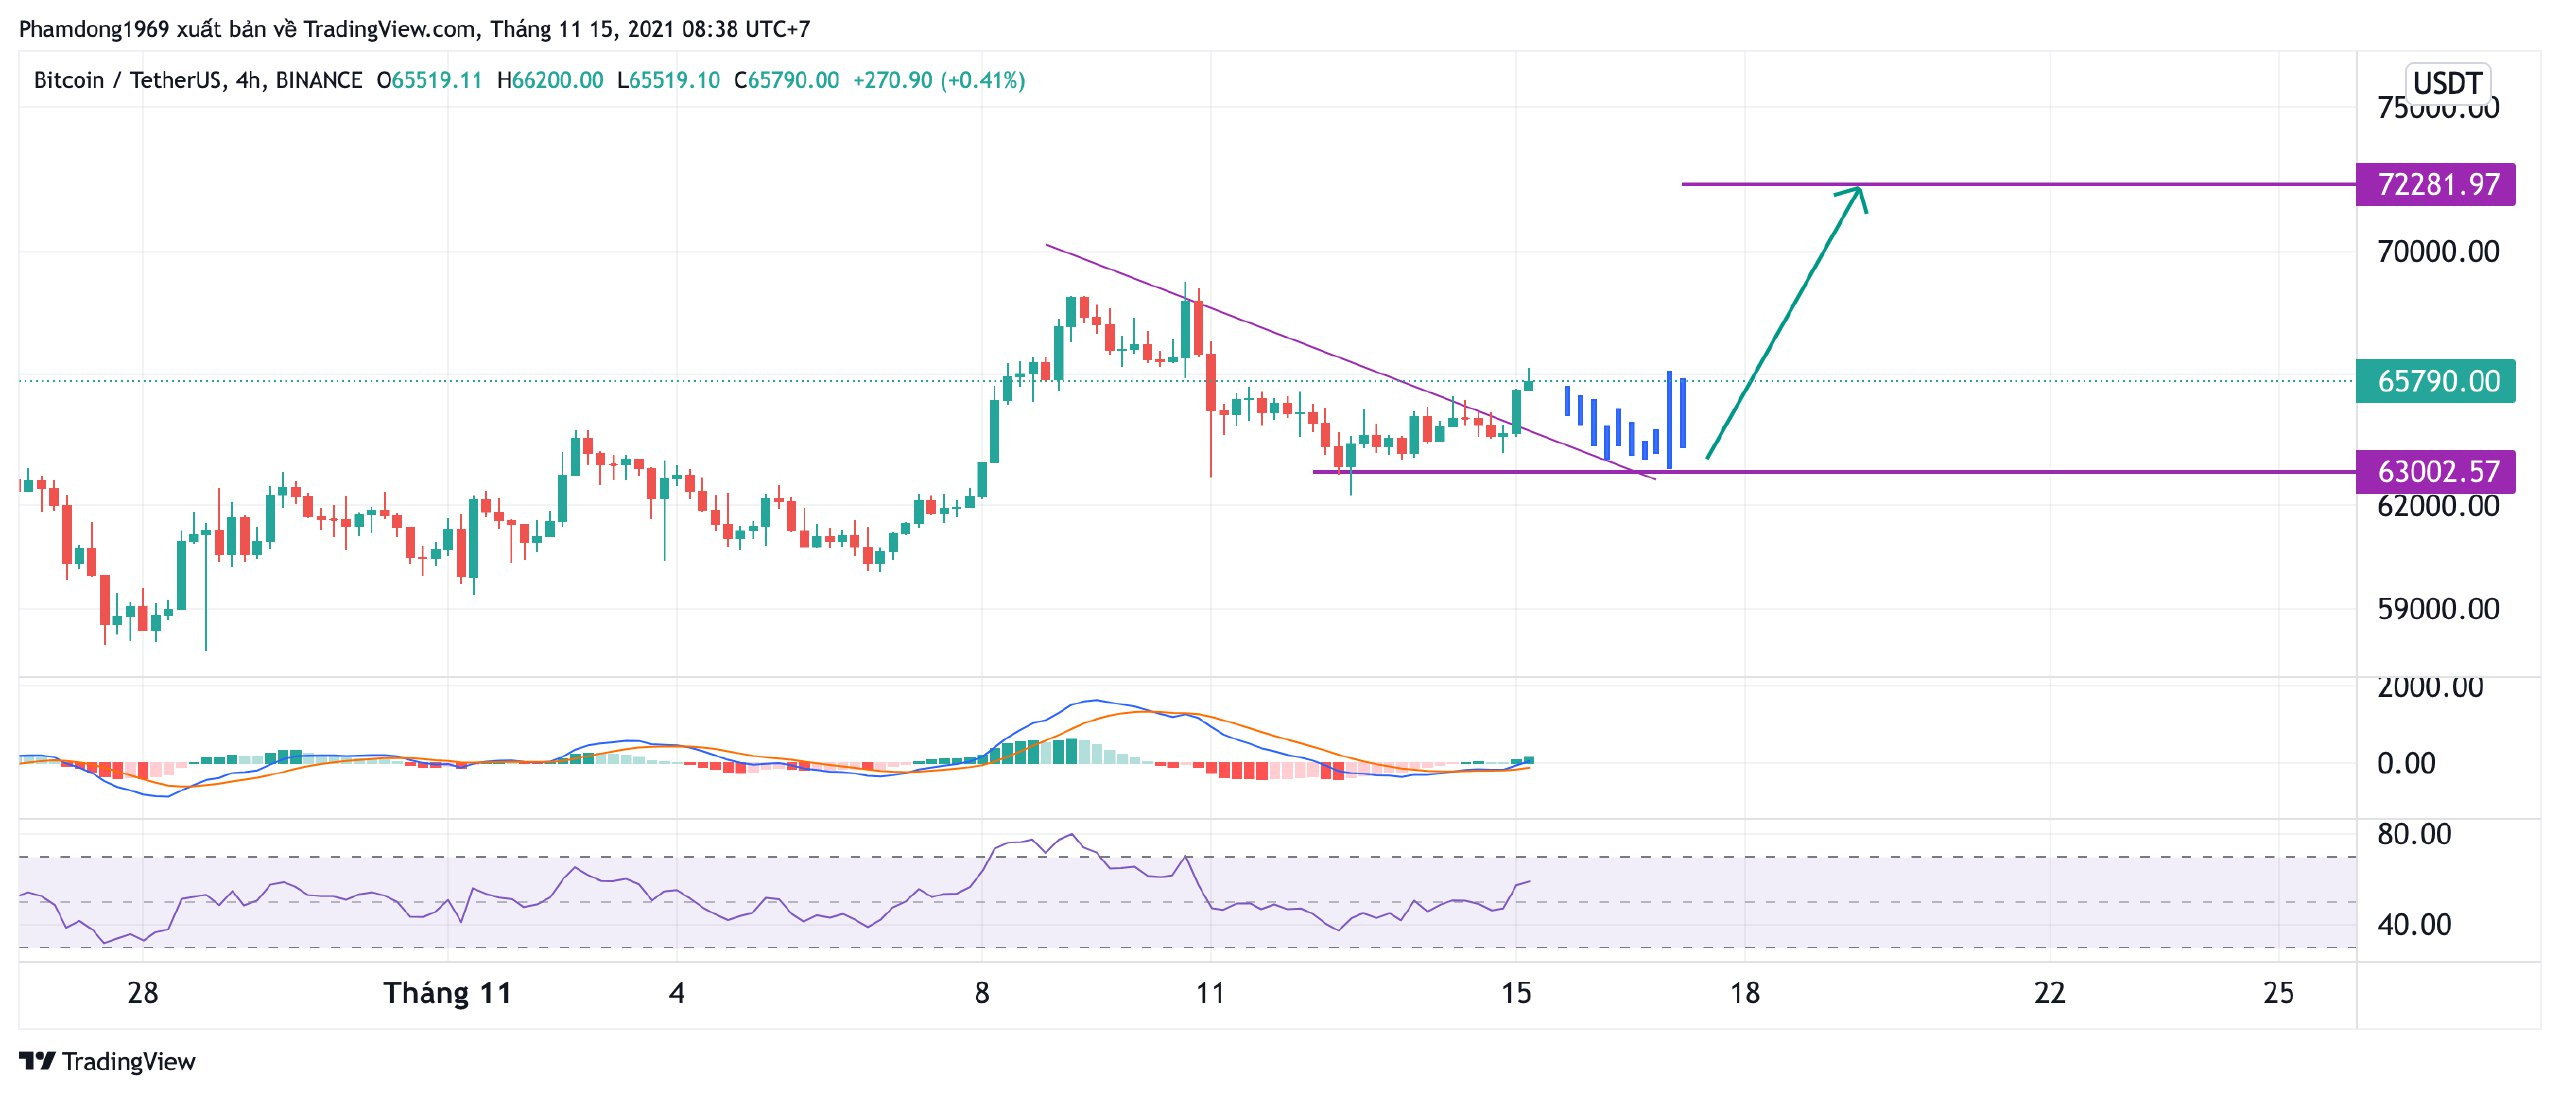
On the 4H chart, the price is showing signs of correction in the short term. The price will fluctuate in the area from 63k to 73k this week.
Goodluck!