


Weekly Bitcoin Technical Analysis (November 1st, 2021)


History for the week (From 25-31th/Oct, 2021)
Opening price: $60,852, closing price: $61,299 => Spread is $447, down about 0.7%).
Highest price: $63,710, lowest price $57,820 => Spread is $5890 (According to data from Binance exchange).
Technical Analysis
BTC/USDT weekly chart

The weekly chart shows the bulls are still dominant with the price target at 114k. However, Bitcoin price will undergo many corrections in the process of reaching new all-time-high.
There have 2 Doji candles in the past 2 weeks, which shows the indecision between buyers and sellers.To determine the short-term trend of the Bitcoin price, we will turn to the analysis on the daily chart.
BTC/USDT daily chart
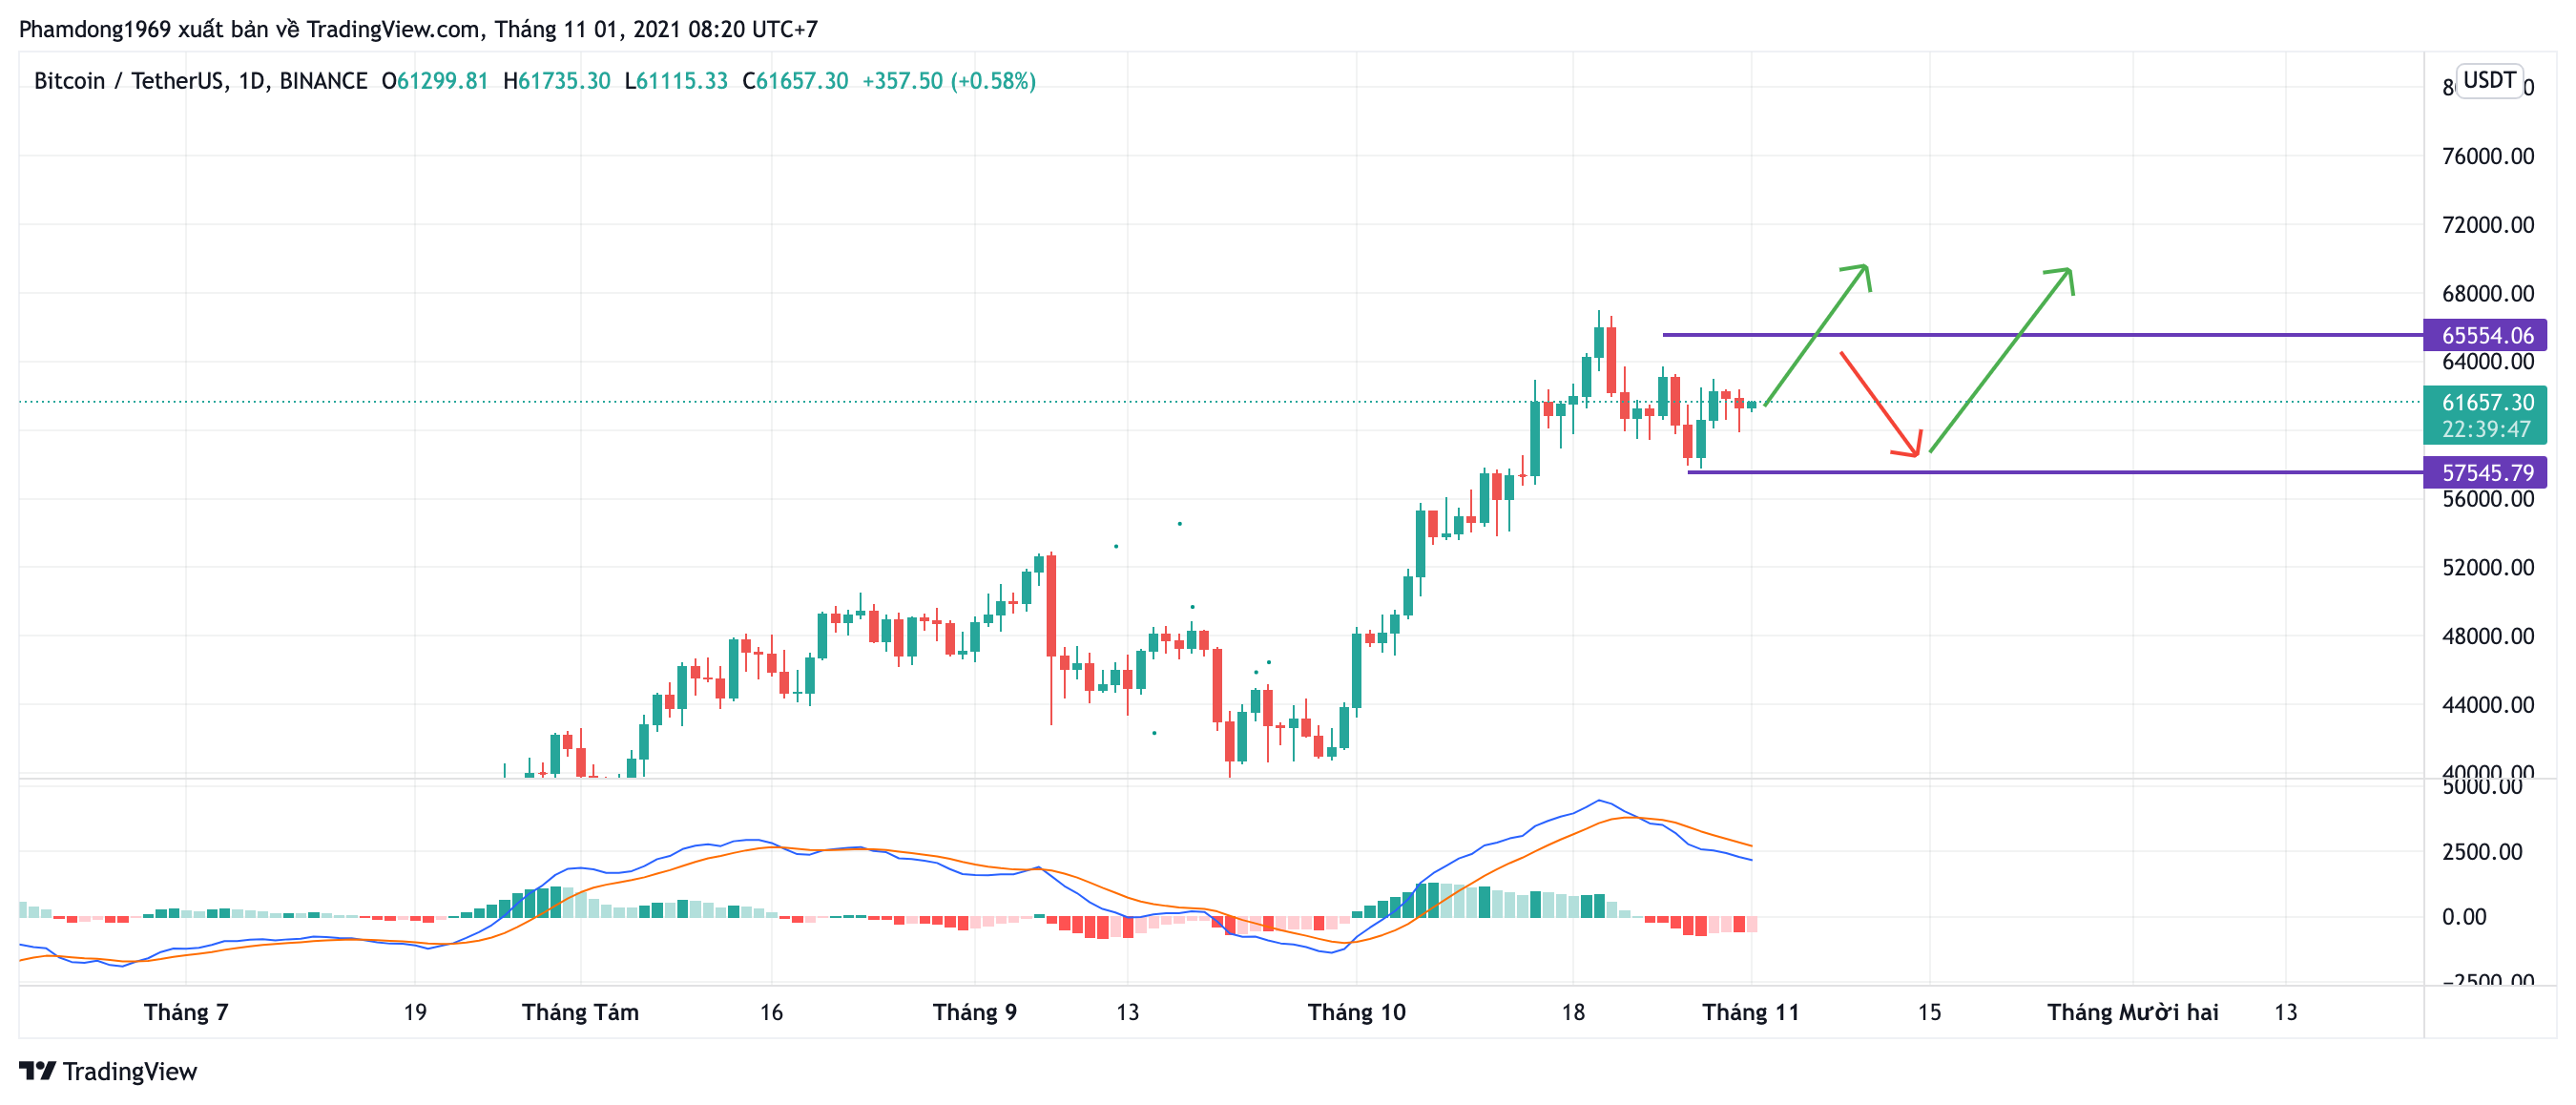
Based on the price action on the daily chart, we can predict 2 scenarios for Bitcoin price:
The price could drop to an important support at $57k~$58k zone in the next 2-3 days,the bulls will then push the price to break the ATH ($65k~$66k) zone on the weekends.
From the current price, Bitcoin could rise to the ATH zone and then there will be a sharp price correction at the end of the week. We expect the price to stay at the support level (at $57k~$58k) after the correction.
Goodluck.