Weekly Bitcoin Technical Analysis (Septemper 13th, 2021)
History for the week (From 6-12th-Sep, 2021)
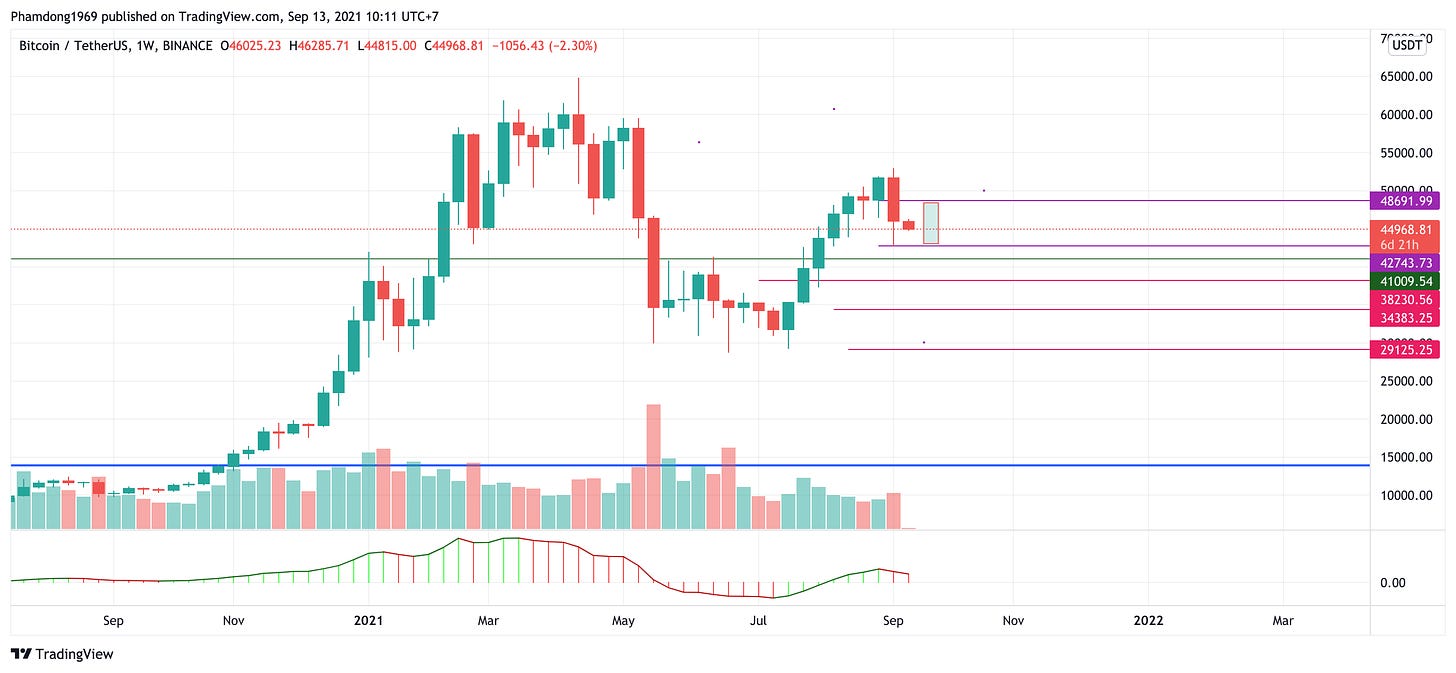
Opening price: $51,756, closing price: $46,025 => Spread is $5731, down about 11%).
Highest price: $52,920, lowest price $42,843 => Spread is $10077 (According to data from Binance exchange).
Technical Analysis
BTC/USDT weekly chart
BTC/USDT weekly chart — Tradingview
As we meantioned the candlestick counting method lastweek. Bitcoin price has fallen sharply, forming a bearish engulfing candle compared to the previous three candles. To get a more accurate view in the short term, we will change to the daily time frame.
BTC/USDT daily chart
BTC/USDT daily chart — Tradingview
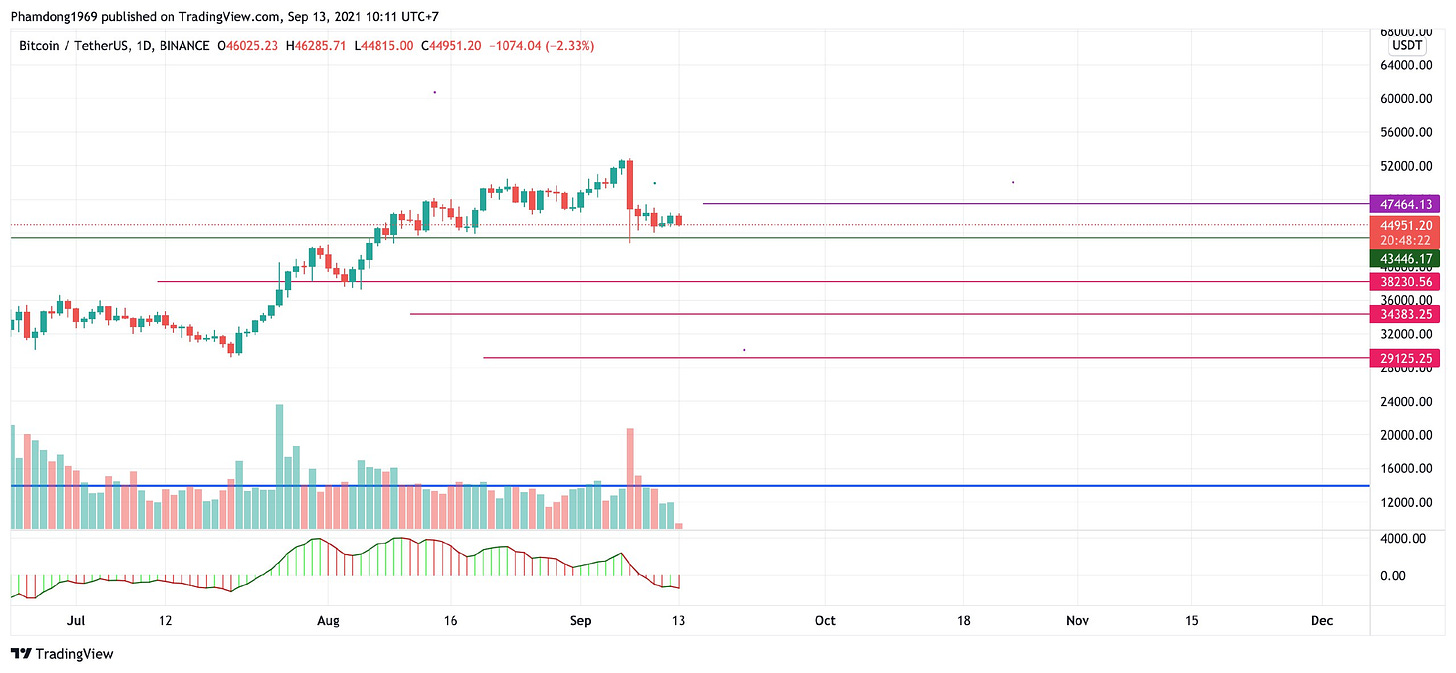
A candle on 7 Sep engulfed the entire price range of the previous 17 days. The bears are likely to defend the overhead zone aggressively (around 43.5k) but if the bull keep the price above this support (no daily candle closes below 43.5k),the bullish expectations will remain with the target price at resistances zones at ~47k,~50k,~58k.
On the other hand, if the price breaks below 43,5k, we will have support levels of ~38.2k, ~34.4k, ~29k, respectively.
BTC/USDT 4H chart — Tradingview
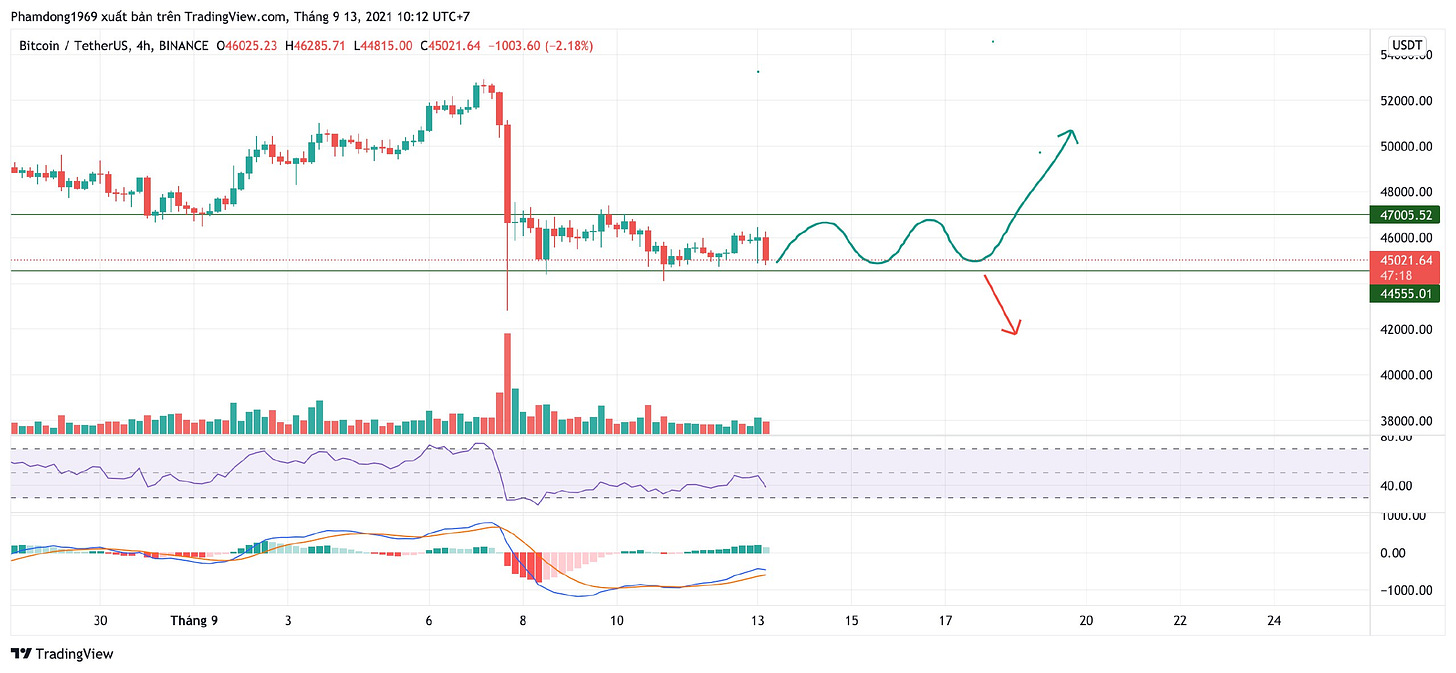
For the 4H time frame chart, Bitcoin price is moving in a rectangular box. If the price break below ~44,5k today or tomorrow, we should exit the long positions out of the market.
On the contrary, if the bulls push the price up and close above the breakout level at 47k, we’ll expect the price to return to the uptrend with the target prices mentioned above.
Goodluck


