


Weekly Bitcoin Technical Analysis (May 17th, 2021)
The downtrend on daily and daily charts is clear.

The downtrend on daily and daily charts is clear.
Last week we saw a deeply bearish week with a high of $59,600 and a low of $43,700 forming a red candle covering ahead. With that, an opening price of $58,300 and a closing price of $48,400 equates to a 20% drop.
Follow Wall Street Investment Funds
Last week investment funds sold 0.06% ~ 1,500 BTC. Last week, investment funds bought very strongly, but this week sold out but with a small volume.

Movement of cash flow
We have seen a positive amount of #Bitcoin moving from wallet to exchange in the past three weeks. As a result, creating selling pressure is weighing on the market.
Last week 31,523 #BTC moved from the exchange to the wallet, and 51,372 #BTC moved from the wallet to the exchange, i.e., the amount of Bitcoin transferred from the wallet to the exchange was 19,849; this is a relatively large amount.
However, with the positive amount of USDT transferred from the outside in, 3,153,689,912 USDT (6,039,140,790 USDT moved into the exchange compared to 2,885,450,878 USDT moved out) shows a positive sign.
Bitstamp BTC/USD: Weekly Chart
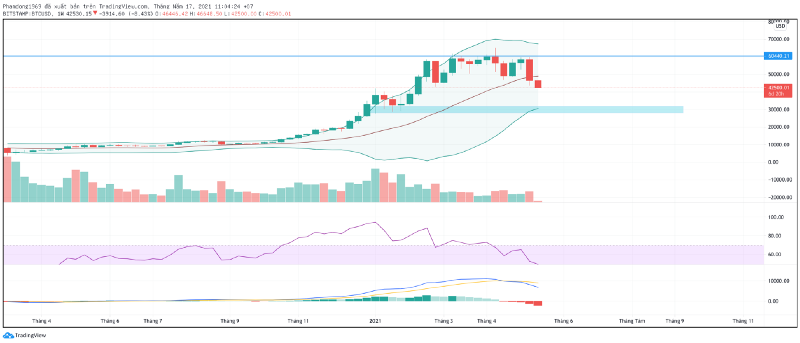
We see 11 weeks the price does not break out of the $61,000 area. This is one of the alarming signs of Bitcoin.
The price closed below the MA20; on the weekly chart, MACD has cut down, the RSI has plunged. Shows that the $29,000 — $31,000 support zone coincides with Fibo 0.618.
Bitstamp BTC/USD: 4D Chart
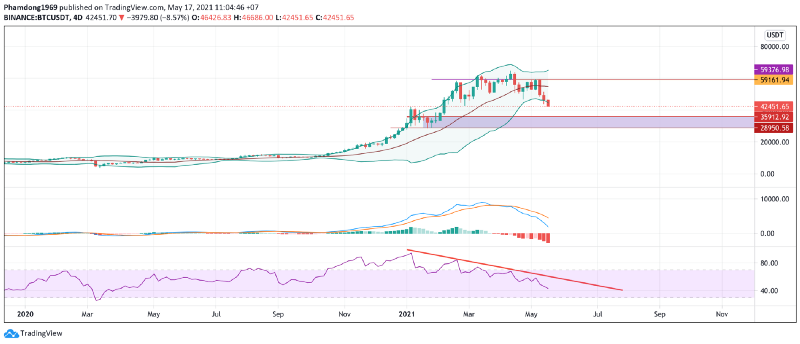
MACD cut down to nearly zero lines; RSI is still on the way down.
Also, on the chart, we see the price is above the BB, so we can expect a pullback after 1–2 sessions of deep plunge.
Bitstamp BTC/USD: Daily Chart
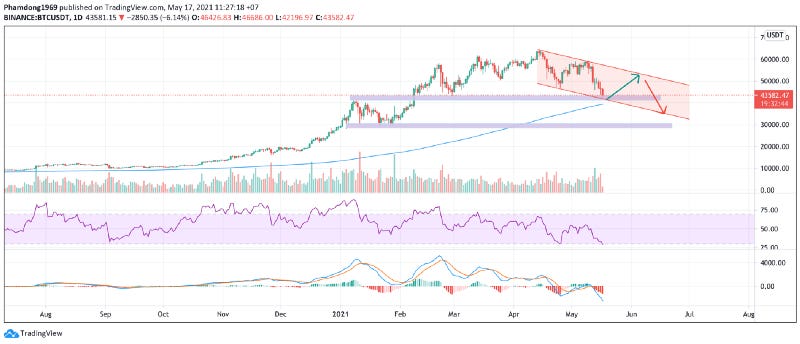
A bearish channel has formed.
Hard Support Zone: $39,000 — $41,000.
Thank you for reading our analysis!