Weekly Bitcoin Technical Analysis (May 31th, 2021)
History for the week (From May 24 to 30, 2021)
History for the week (From May 24 to 30, 2021)
Opening price: $34,681, closing price: $35,641 => Spread is $960, down about 2.76%
Highest price: $40,841, low price $33,379 => Spread is $7,462, down about 18.3% (According to data from Binance exchange)
Fundamental Analysis
Fundamental crypto market bearishness, including uncertainty about bitcoin as an inflation hedge after U.S. President Joe Biden’s administration released a $6 trillion budget plan as well as continuing concerns about bitcoin mining causing damage to the environment likely led to selling Friday,…
Technical Analysis
BTC/USDT weekly chart
Last week the bar formed a candlestick like a Doji. It shows that the market is showing indecision between buyers and sellers. Based on the bars in the red rectangle and the top of the bar lastweek, we can predict that the price may fluctuate in range 29k to 42k. Therefore, the downtrend is still present on the weekly chart.
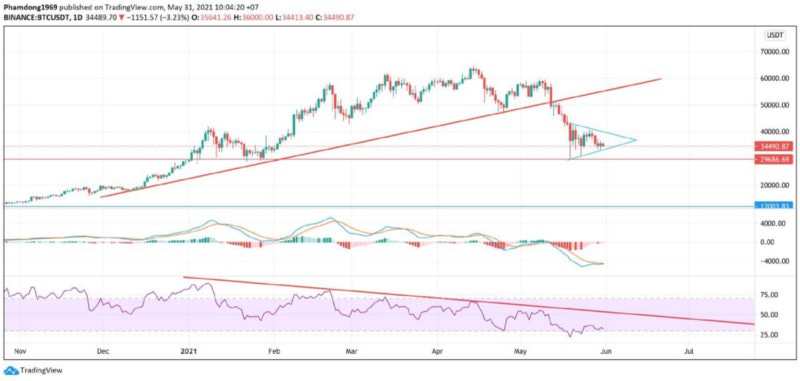
BTC/USDT daily chart
The bars formed the triangle pattern. The price will go inside the triangle until it can break down (up/down). In short-term, it may fluctuate in range 33k to 39k. If the price breaks the lower edge of the triangle, the next could be 29k support zone.
On the other hand, if the price turns up and breaks the upper edge, it may go to the resistance zone 57k, 58 or further.
For the indicator:
MACD is still converging.
RSI is still goes down, however, if it reverses and breaks the trendline 53 => The uptrend will resume.
BTC/USDT 4h
A sideways trend is triangle pattern movement after a deep drop, technical analysis in the short time frame is not indicative.


